Datadog is a popular platform for monitoring infrastructure. In this post, we’ll discuss how Datadog can be used to monitor a Postgres database using metrics emitted by the database. We’ll then discuss using Cyral’s sidecar to enhance visibility into your database activity. To illustrate this, we’ll use a sample Postgres database hosted in Amazon Relational Database Service (RDS).
Monitoring Key Metrics with Datadog
To monitor a database in RDS, a Datadog agent needs to be set up in your AWS account where the database is running. Datadog’s instructions for setting up the agent can be found here. A typical Postgres monitoring setup might watch the following metrics:
- Read query throughput and performance
- Write query throughput and performance
- Replication and reliability
- Resource utilization
- Connections
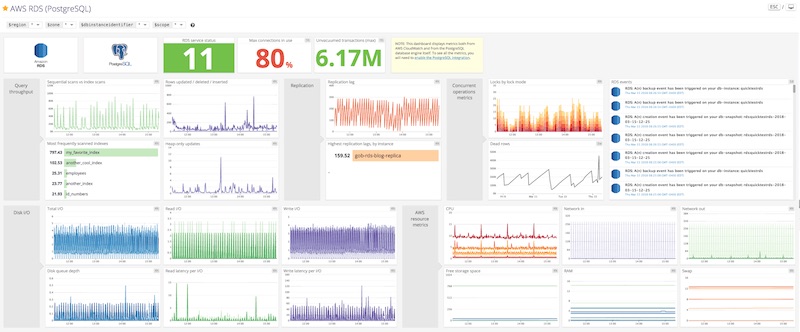
The above metrics are discussed in detail in this blog post by Datadog. While not required for this post, a typical Postgres monitoring dashboard would include most of the metrics itemized above and might look something like this:
Enhancing visibility with Cyral
We’ll discuss two scenarios where Cyral can augment the metrics above to provide unparalleled visibility into the monitored databases. We’ll see how Cyral augments the metrics with query level parameters and allows you to monitor parameters that are undiscoverable with existing tools.
Monitoring insecure connections
Let’s look at the example of a database that’s set to allow non-TLS connections. Using existing monitoring tools, it’s difficult to figure out if there are any unencrypted connections to the database. At best, this would require custom tooling to be set up around the database, and this would then need to be integrated with existing tools.
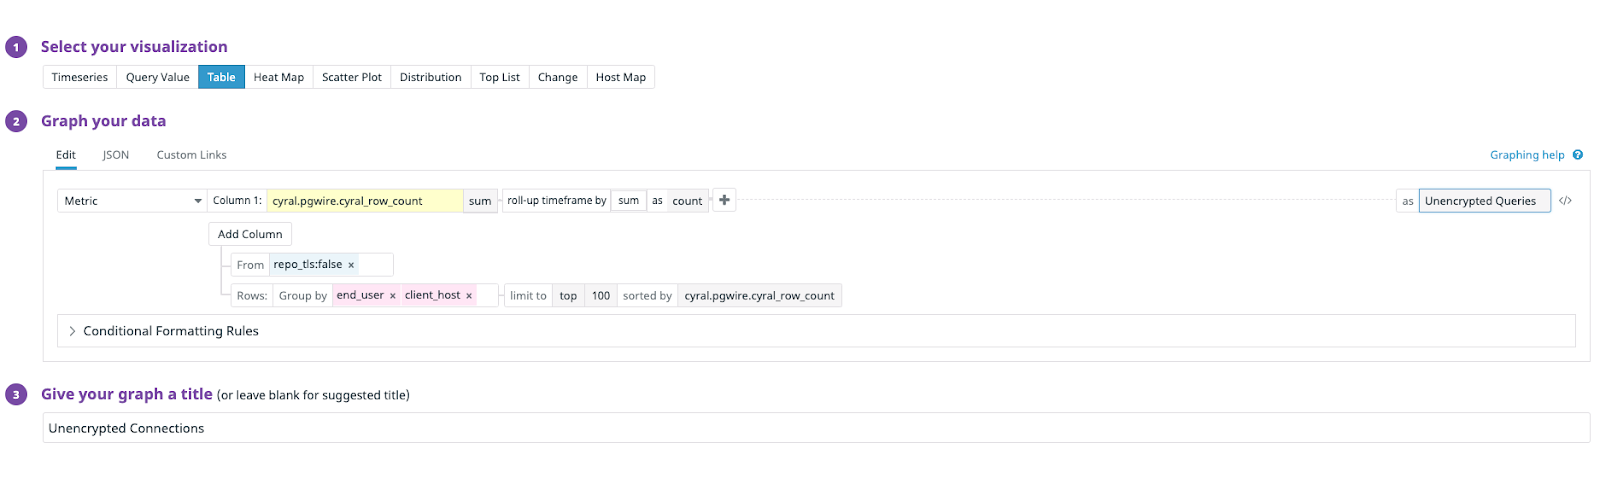
Cyral’s sidecar solves this problem by emitting user-level metrics on each query that passes through. Using these metrics, tools like Datadog can provide a clear picture of unencrypted connections. For example, a graph of cyral_row_count can be set up in Datadog’s graphing editor using the formula shown below:
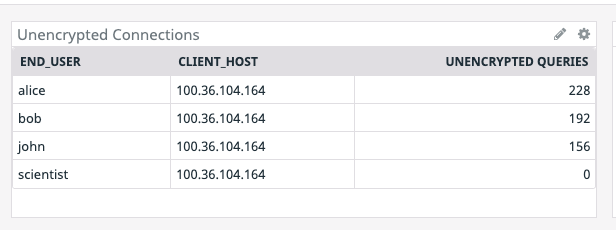
This results in a Datadog graph that tabulates all the unencrypted queries run by users.
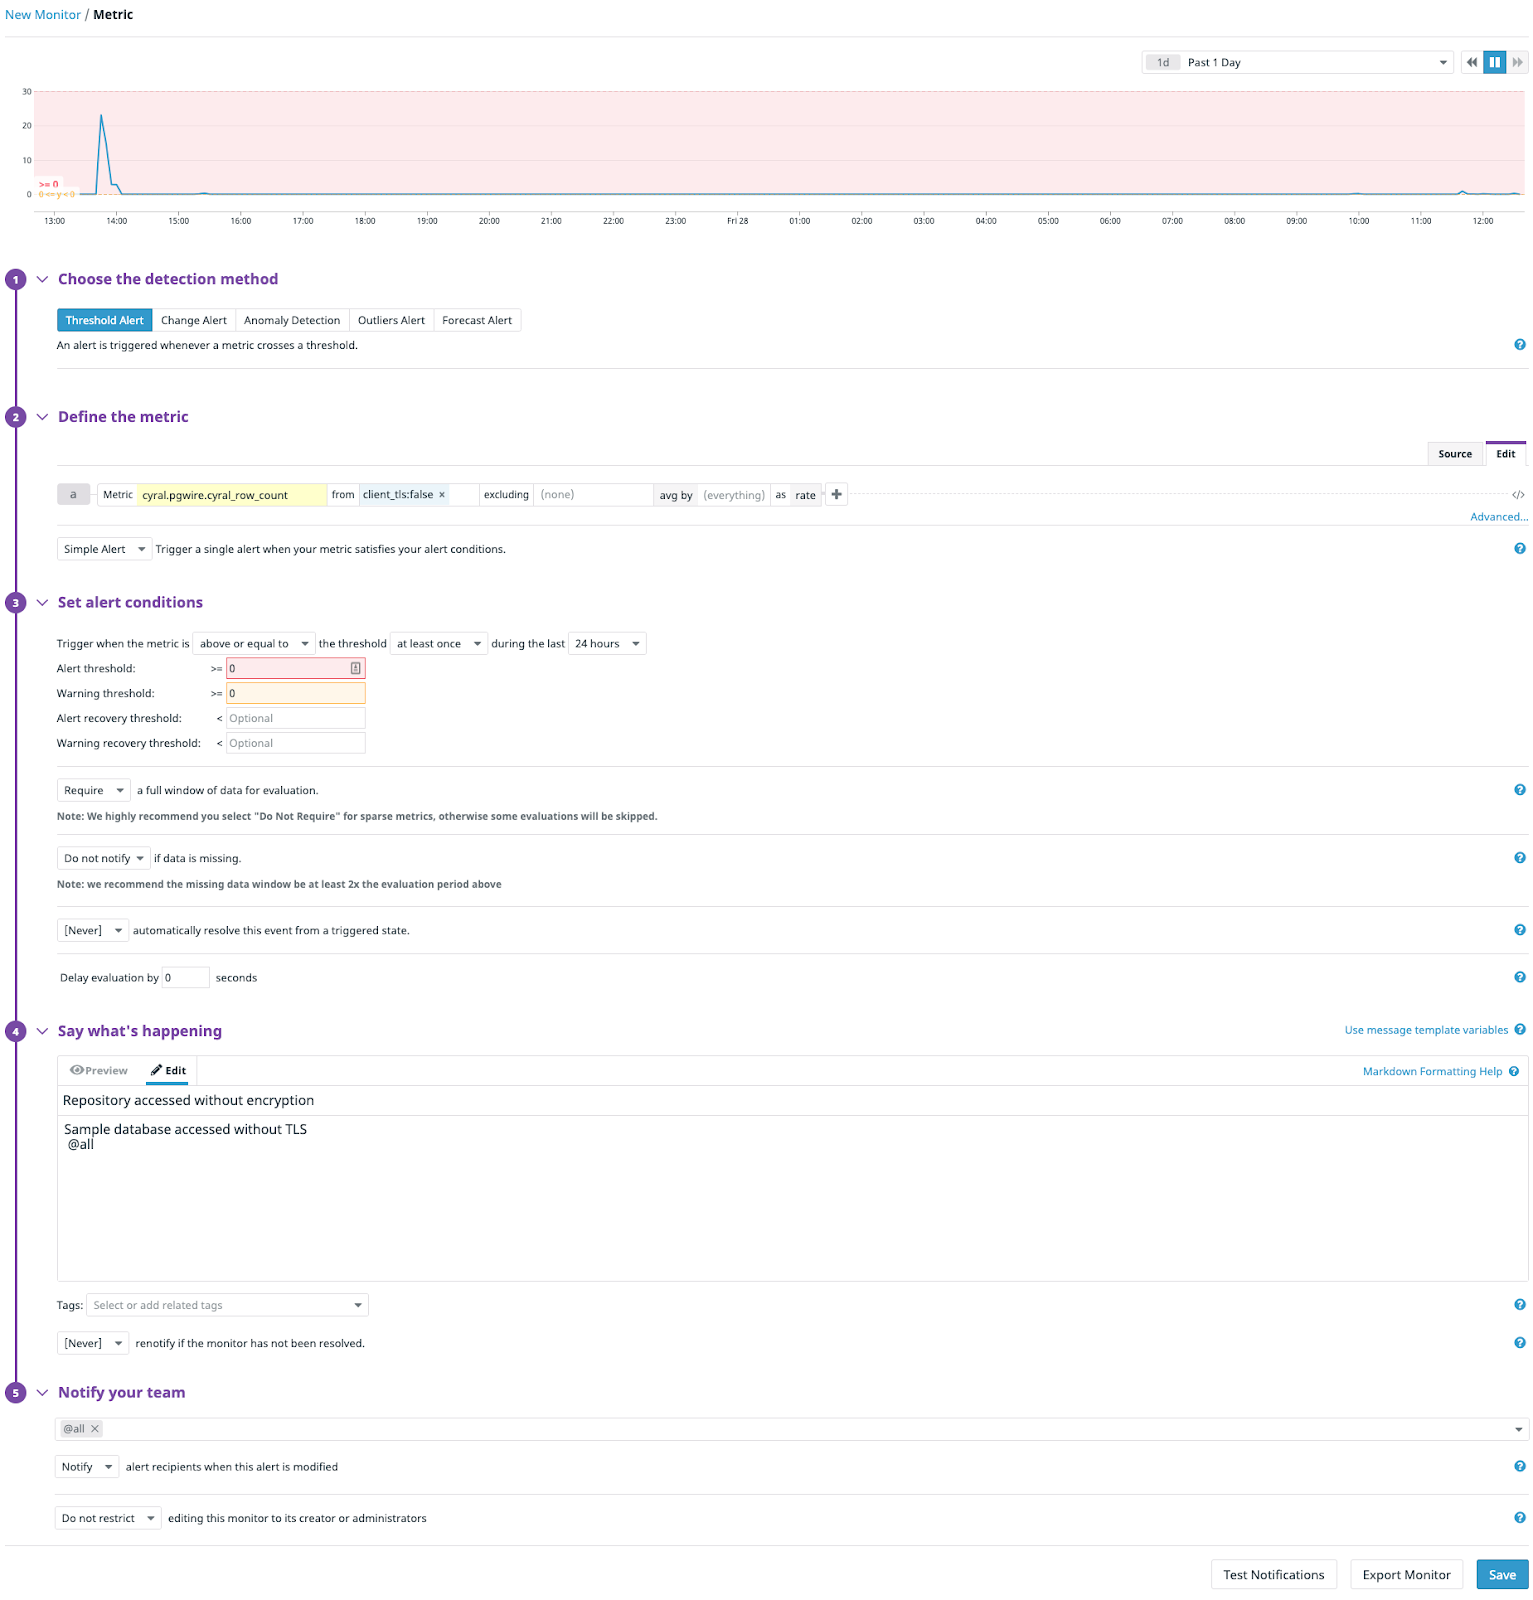
This level of detail can be incredibly useful for alerting as well as auditing. In the above example, setting up an alert that fires when the metric repo_tls is false would provide immediate alerts for stakeholders each time a client establishes a non-TLS connection. A sample monitor setup is shown below:
Know exactly who’s querying the database
Cyral’s sidecar helps you see the actual end-user responsible for each database operation, even when the database client doesn’t expose this information. Many database client tools use a single set of credentials to allow multiple users to access the database. These shared credentials are provided as an unchanging parameter that the client tool uses to establish its database connection, allowing access by multiple different users.
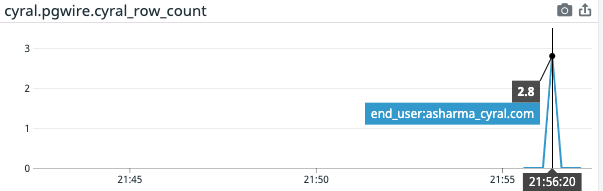
Because Cyral integrates with many tools—including SSO platforms—it provides user-level visibility of the databases’ activity, regardless of the credentials used in the client tool’s connection string. For example, a Looker user can be distinguished, even when the Looker instance uses shared connection credentials. The disambiguation is done using the end_user metric that was visible in the Datadog table, above. If a user (say asharma@cyral.com) were to run queries against the database; that user would show up in the graph of end-users as shown below.
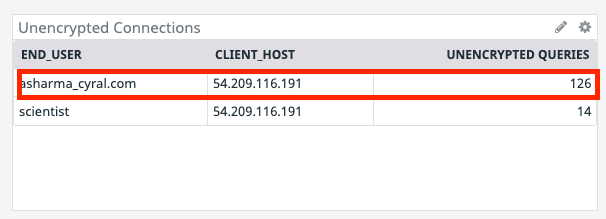
In the above example; the end-user is asharma_cyral.com while the connection user is scientist. Additionally; the end_user metric can also be used to filter metrics on a per-user basis, as shown below.
Enhanced performance metrics
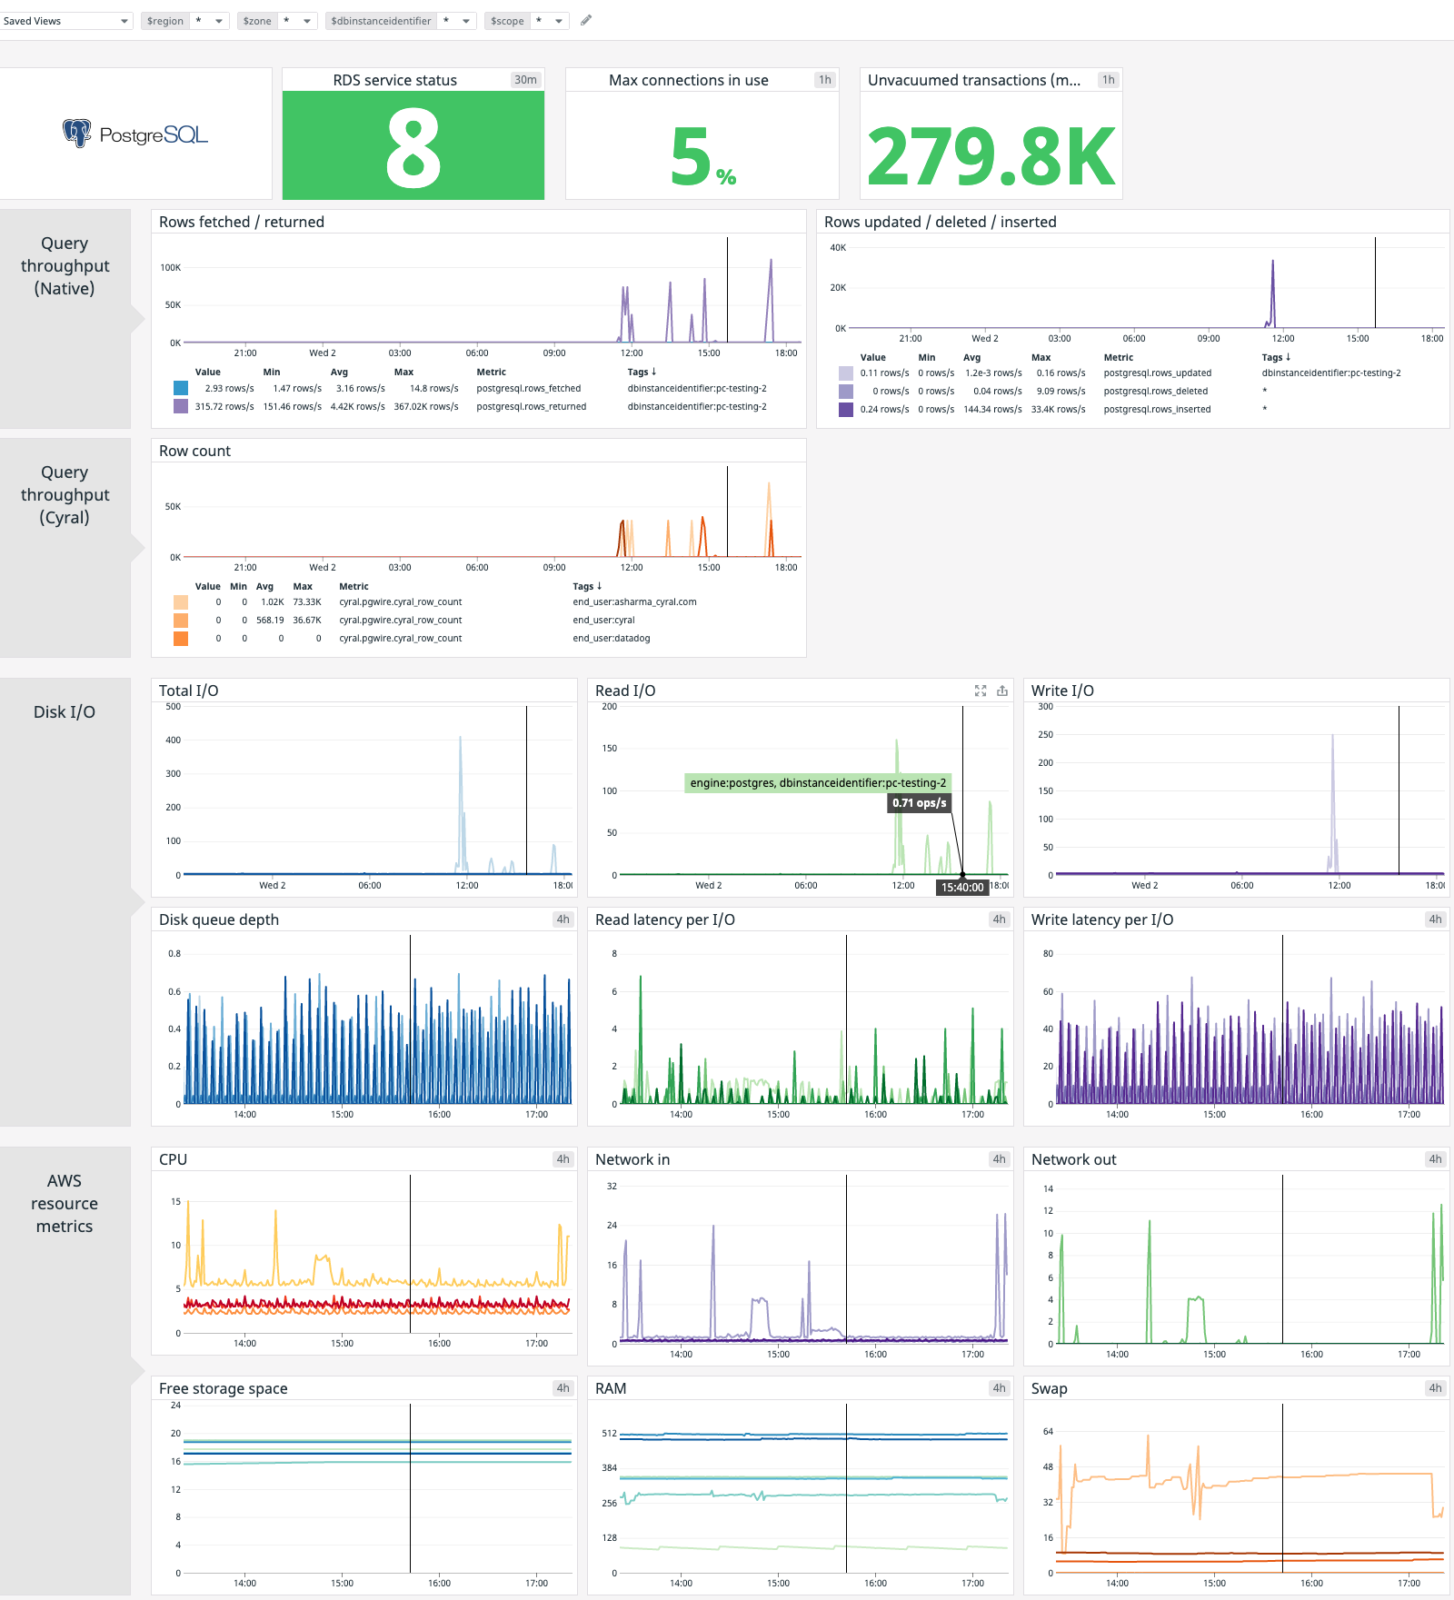
Metrics emitted by Cyral can be used to distinguish which users and processes are accessing the database. These metrics can be used to augment existing metrics published by the database. Below, we show this in a modified Datadog dashboard for Postgres running in RDS.

Native query throughput measurements provide a good measure of the overall query performance of the database. For example, from the dashboard above we note that there was a spike in rows written at around 6:47 PM.

However, looking at this graph alone it’s impossible to understand the cause of these writes to the database. Combined with Cyral it’s simple to discern the user responsible for these queries.
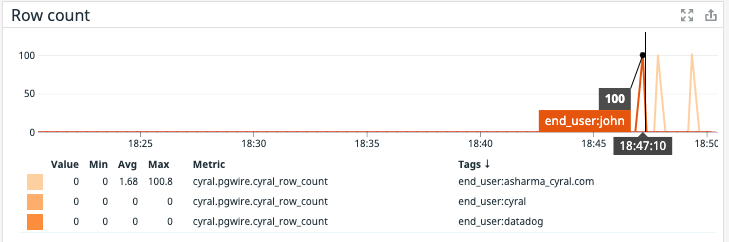
It appears that the user John executed some of these queries…

and the user asharma_cryal.com executed the rest of the queries. The user ‘asharma_cyral.com’ is running queries in Looker using a shared credential. Cyral can distinguish between the end-user logged into the Looker account based on the user value in the credential string, and it emits the corresponding end_user in the metrics.
A similar discovery can be made from the read performance of the database.
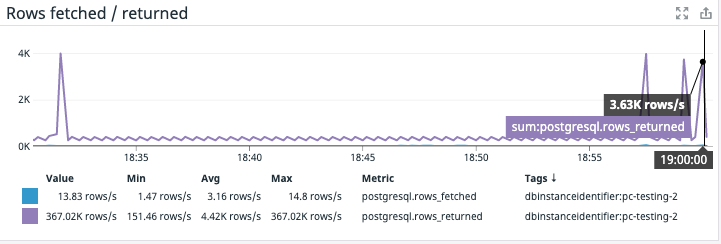
In the example above, there are a couple of spikes in reads from the database at the end of the time segment. The corresponding metrics from Cyral reveal the source of these two spikes.
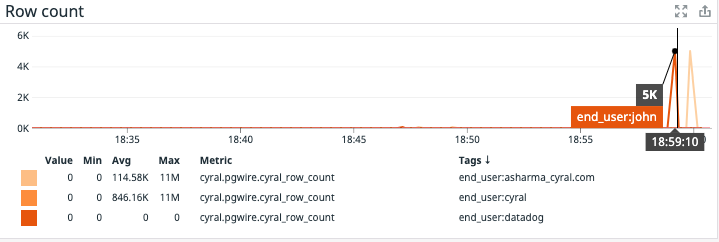
First, user John is reading from the database using a native client (user name john shows up as the end-user)…

and in the second spike, we see that the Looker user is asharma_cyral.com.
The correlation using Cyral can be extended further to include other metrics. For example, the following screenshot highlights CPU usage when the reads in the above example were executed by John and asharma_cyral.com users.
Conclusion
We discussed using Cyral’s rich metrics in Datadog for enhanced visibility into your database traffic. The examples above are simple widgets that can be embedded inside existing dashboards in Datadog. In the next post, we’ll examine using Cyral’s repo logging for even deeper insights into your databases.