Send Cyral logs to ELK stack
Follow the steps below to configure Cyral to output repository activity logs to ELK.
Set up an ELK stack
Deploy AWS Elasticsearch Service
Contact your Cyral support representative to get the deployment template for your cloud environment, and then follow the steps below.
- Cloudformation
- Helm3
Use the ELK CloudFormation template provided by the Cyral support team to deploy the AWS Elasticsearch service using AWS CloudFormation, taking note of the following steps:
First, set the RemoteAccessCIDR range to your corporate IP
addresses while deploying the stack to restrict access to Kibana.
Next, the IAM role AWSServiceRoleForAmazonElasticsearchService is
required to install the ELK template. If it does not yet exist, create it
with the following command:
aws iam create-service-linked-role --aws-service-name es.amazonaws.com
Note:
If you’d like to make the ELK deployment more robust and enable HA, we suggest making the following changes to the template:
       ElasticsearchClusterConfig:
           DedicatedMasterEnabled: false
           InstanceCount: 2
           InstanceType: t3.medium.elasticsearch
           WarmEnabled: false
           ZoneAwarenessEnabled: true
       EBSOptions:
           EBSEnabled: true
           VolumeType: gp2
           VolumeSize: 50
Deploy the ELK stack to Kubernetes using Helm 3. Download the Helm3 template for ELK and enter the appropriate values in the template based on the where you'd like to deploy the ELK cluster.
helm repo add elastic https://helm.elastic.co
export SIDECAR_NAMESPACE=cyral-sidecar
kubectl create namespace $SIDECAR_NAMESPACE
helm install cyral-elasticsearch elastic/elasticsearch --namespace $SIDECAR_NAMESPACE --set imageTag=7.9.3 --set service.type=LoadBalancer
helm install cyral-kibana elastic/kibana --namespace $SIDECAR_NAMESPACE --set imageTag=7.9.3 --set service.type=LoadBalancer
Connect Cyral to your ELK stack
Now that the AWS Elasticsearch service is deployed, let's integrate it with Cyral.
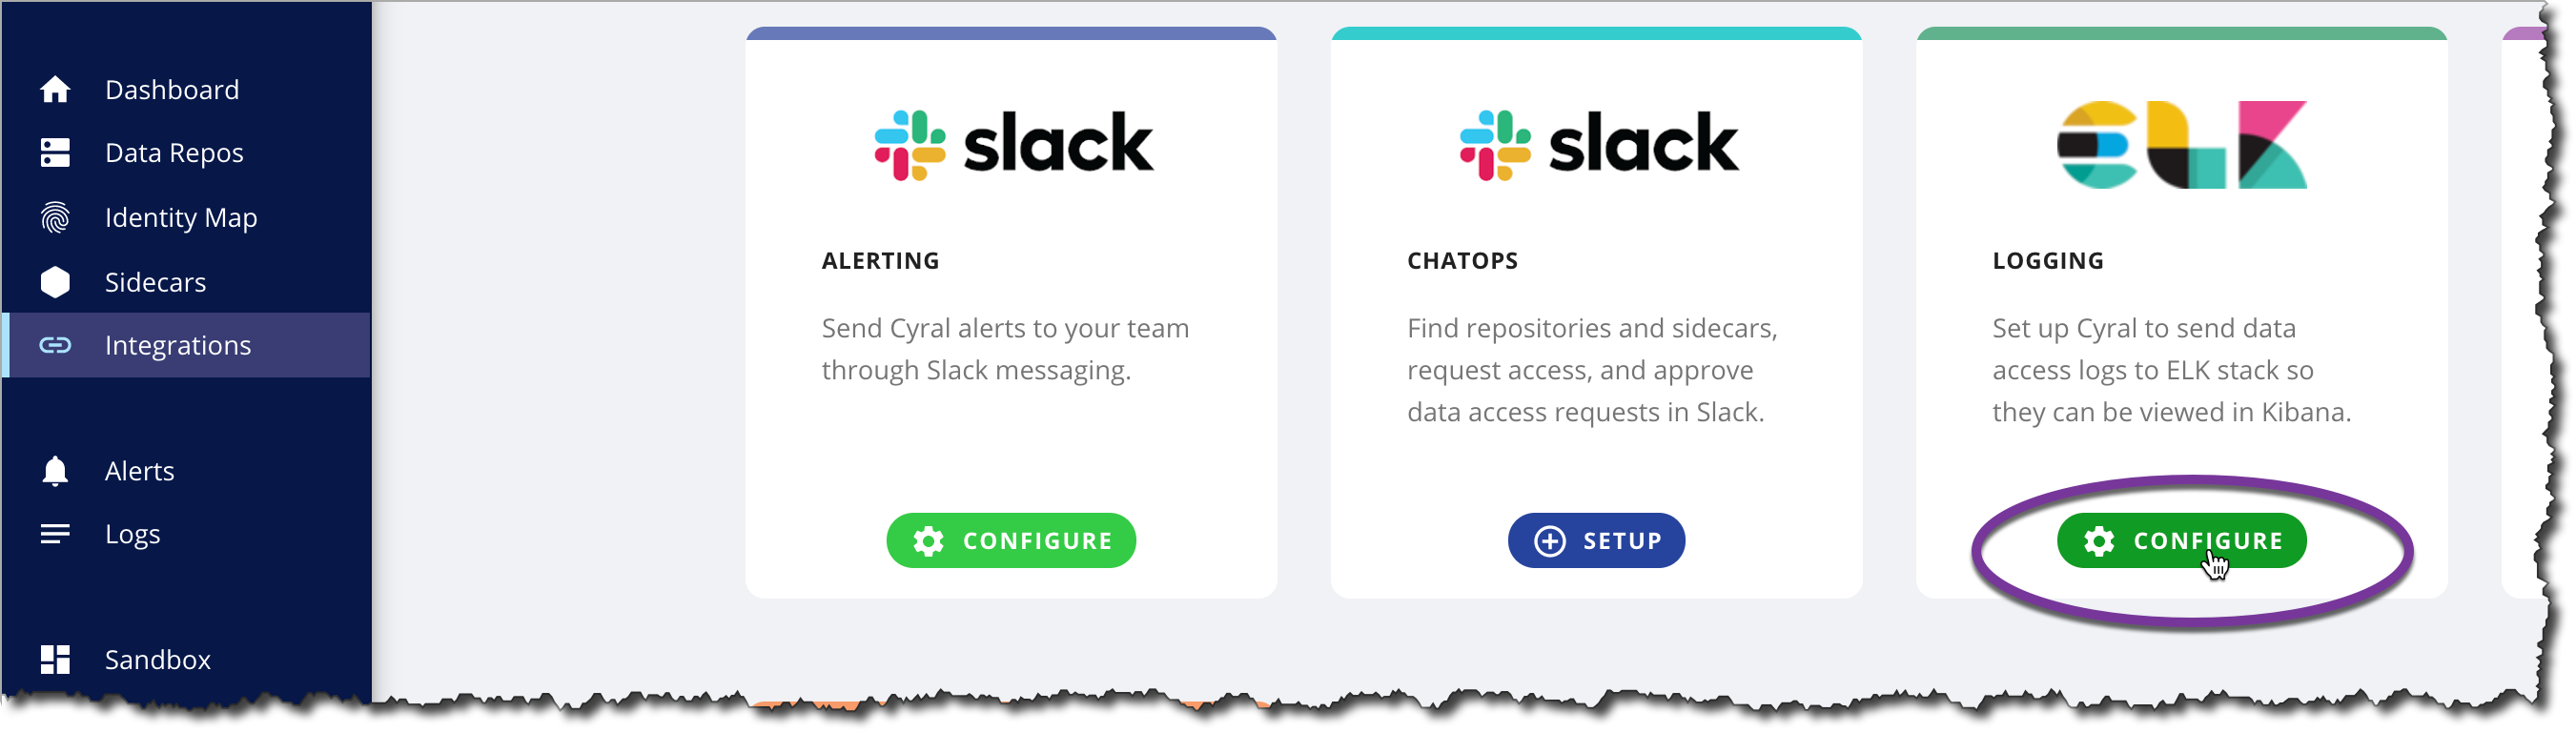
- In the Cyral management console, click Integrations, find the ELK card, and click Setup.
In the ELK configuration form, you will be prompted to enter the following:
- Integration Name: Integration name of your choice.
- Kibana URL: The Kibana server's hostname. If you're using CloudFormation, this matches the
KibanaURLoutput parameter. - Elasticsearch URL: Address where Elasticsearch is available. If you're using CloudFormation, this matches the
ElasticsearchURLoutput parameter.
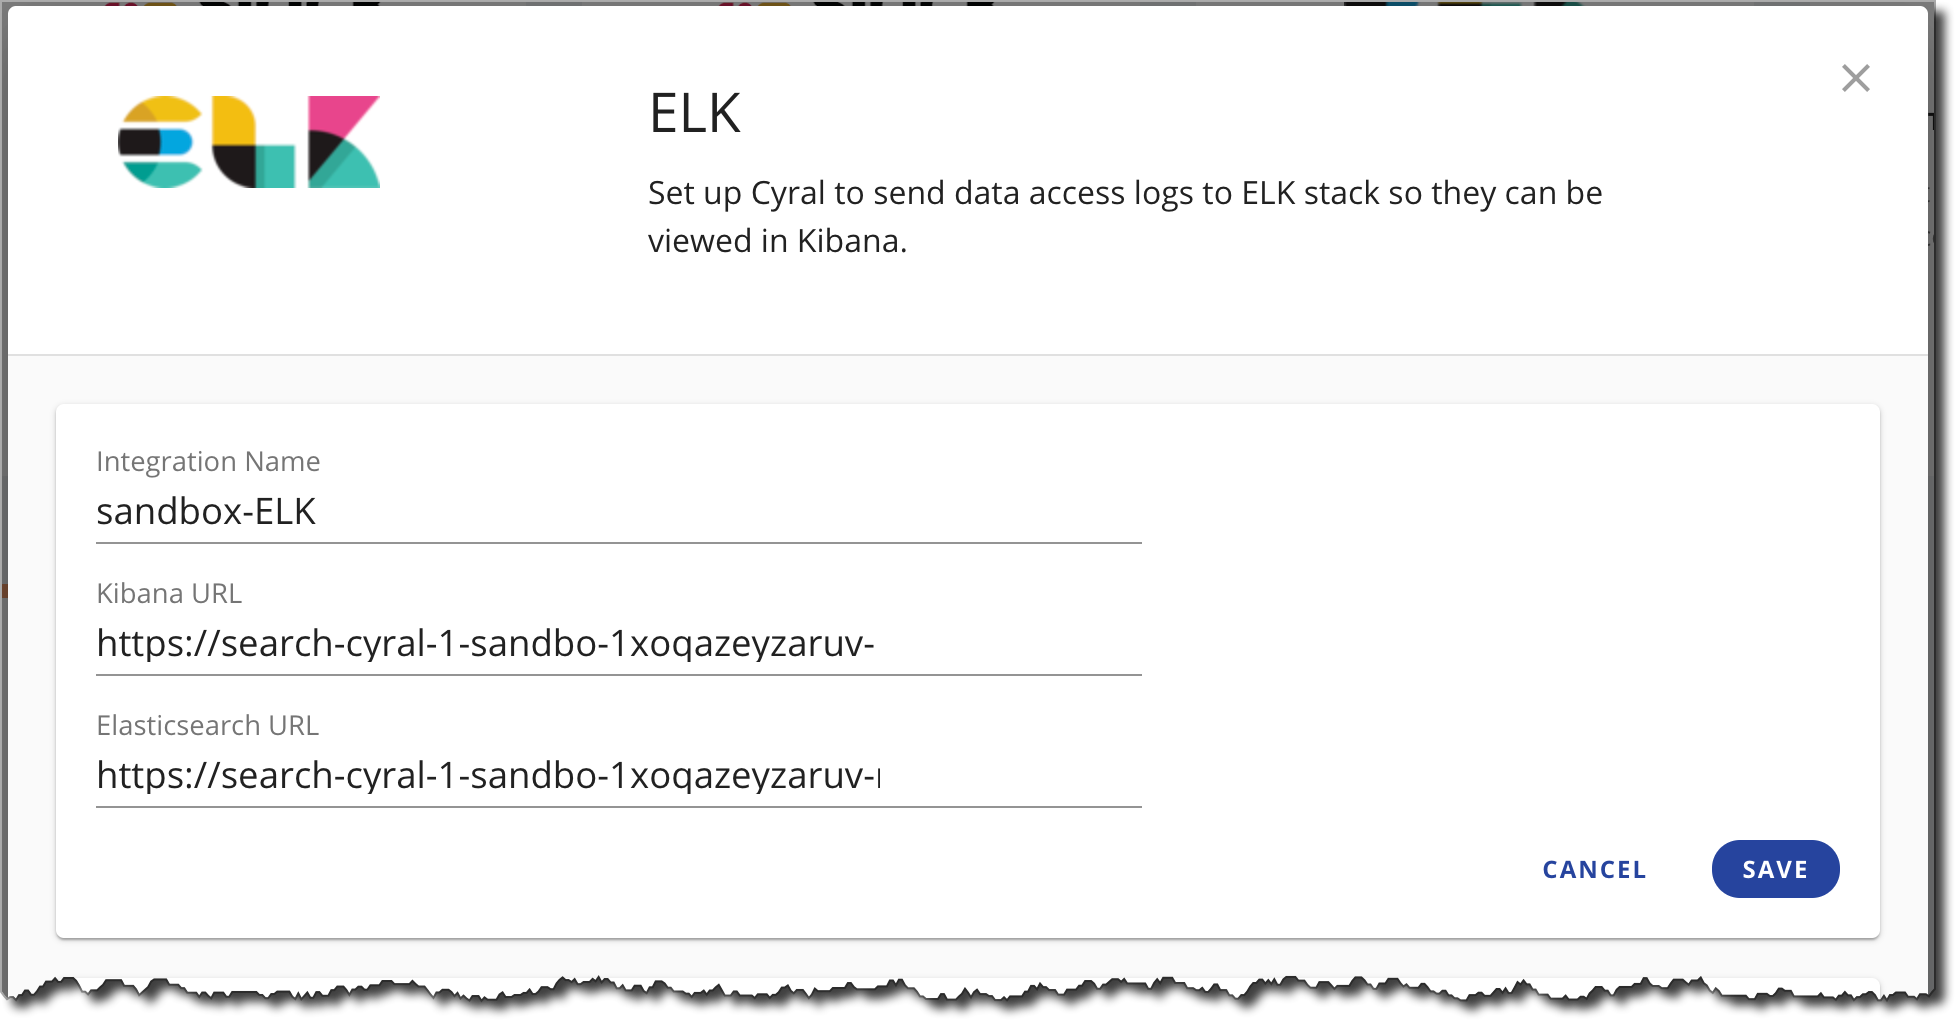
- Click Save to connect the integration.
caution
Each sidecar that will send logs to this log destination will need to be deployed with its Log Integration set to the Integration Name you specified above.
When deploying new sidecars, make sure to choose the name of this Log Integration when you generate the template.
NOTE: Sidecars that are already deployed will need to be redeployed.
Monitor data activity in Kibana
Once the ELK integration is configured, administrators will be able to view and monitor data repository activity logs in Kibana.
Prerequisites
- Set up an ELK stack
- Turn on data activity monitoring for your repository
- Specify your logging preferences for each repository monitored by Cyral.
Generate sample log data
If you haven't already done so, run a few queries to generate query logs.
- If your repository is set to log all activity, any query will do.
- If you have a policy that logs only certain types of activity, run a query that falls within the scope of the policy.
View logs
Access the Kibana dashboard as shown here for your cloud platform:
- AWS Elasticsearch
- Kubernetes
In your browser, visit the Kibana dashboard address provided in the Terraform or Cloudformation output from your deployment. See Set up an ELK stack for deployment details.
Before you can connect to Kibana on Kubernetes, you must forward a local port to a port on the Kibana pod:
kubectl port-forward --namespace $SIDECAR_NAMESPACE svc/cyral-kibana-kibana 5601:5601
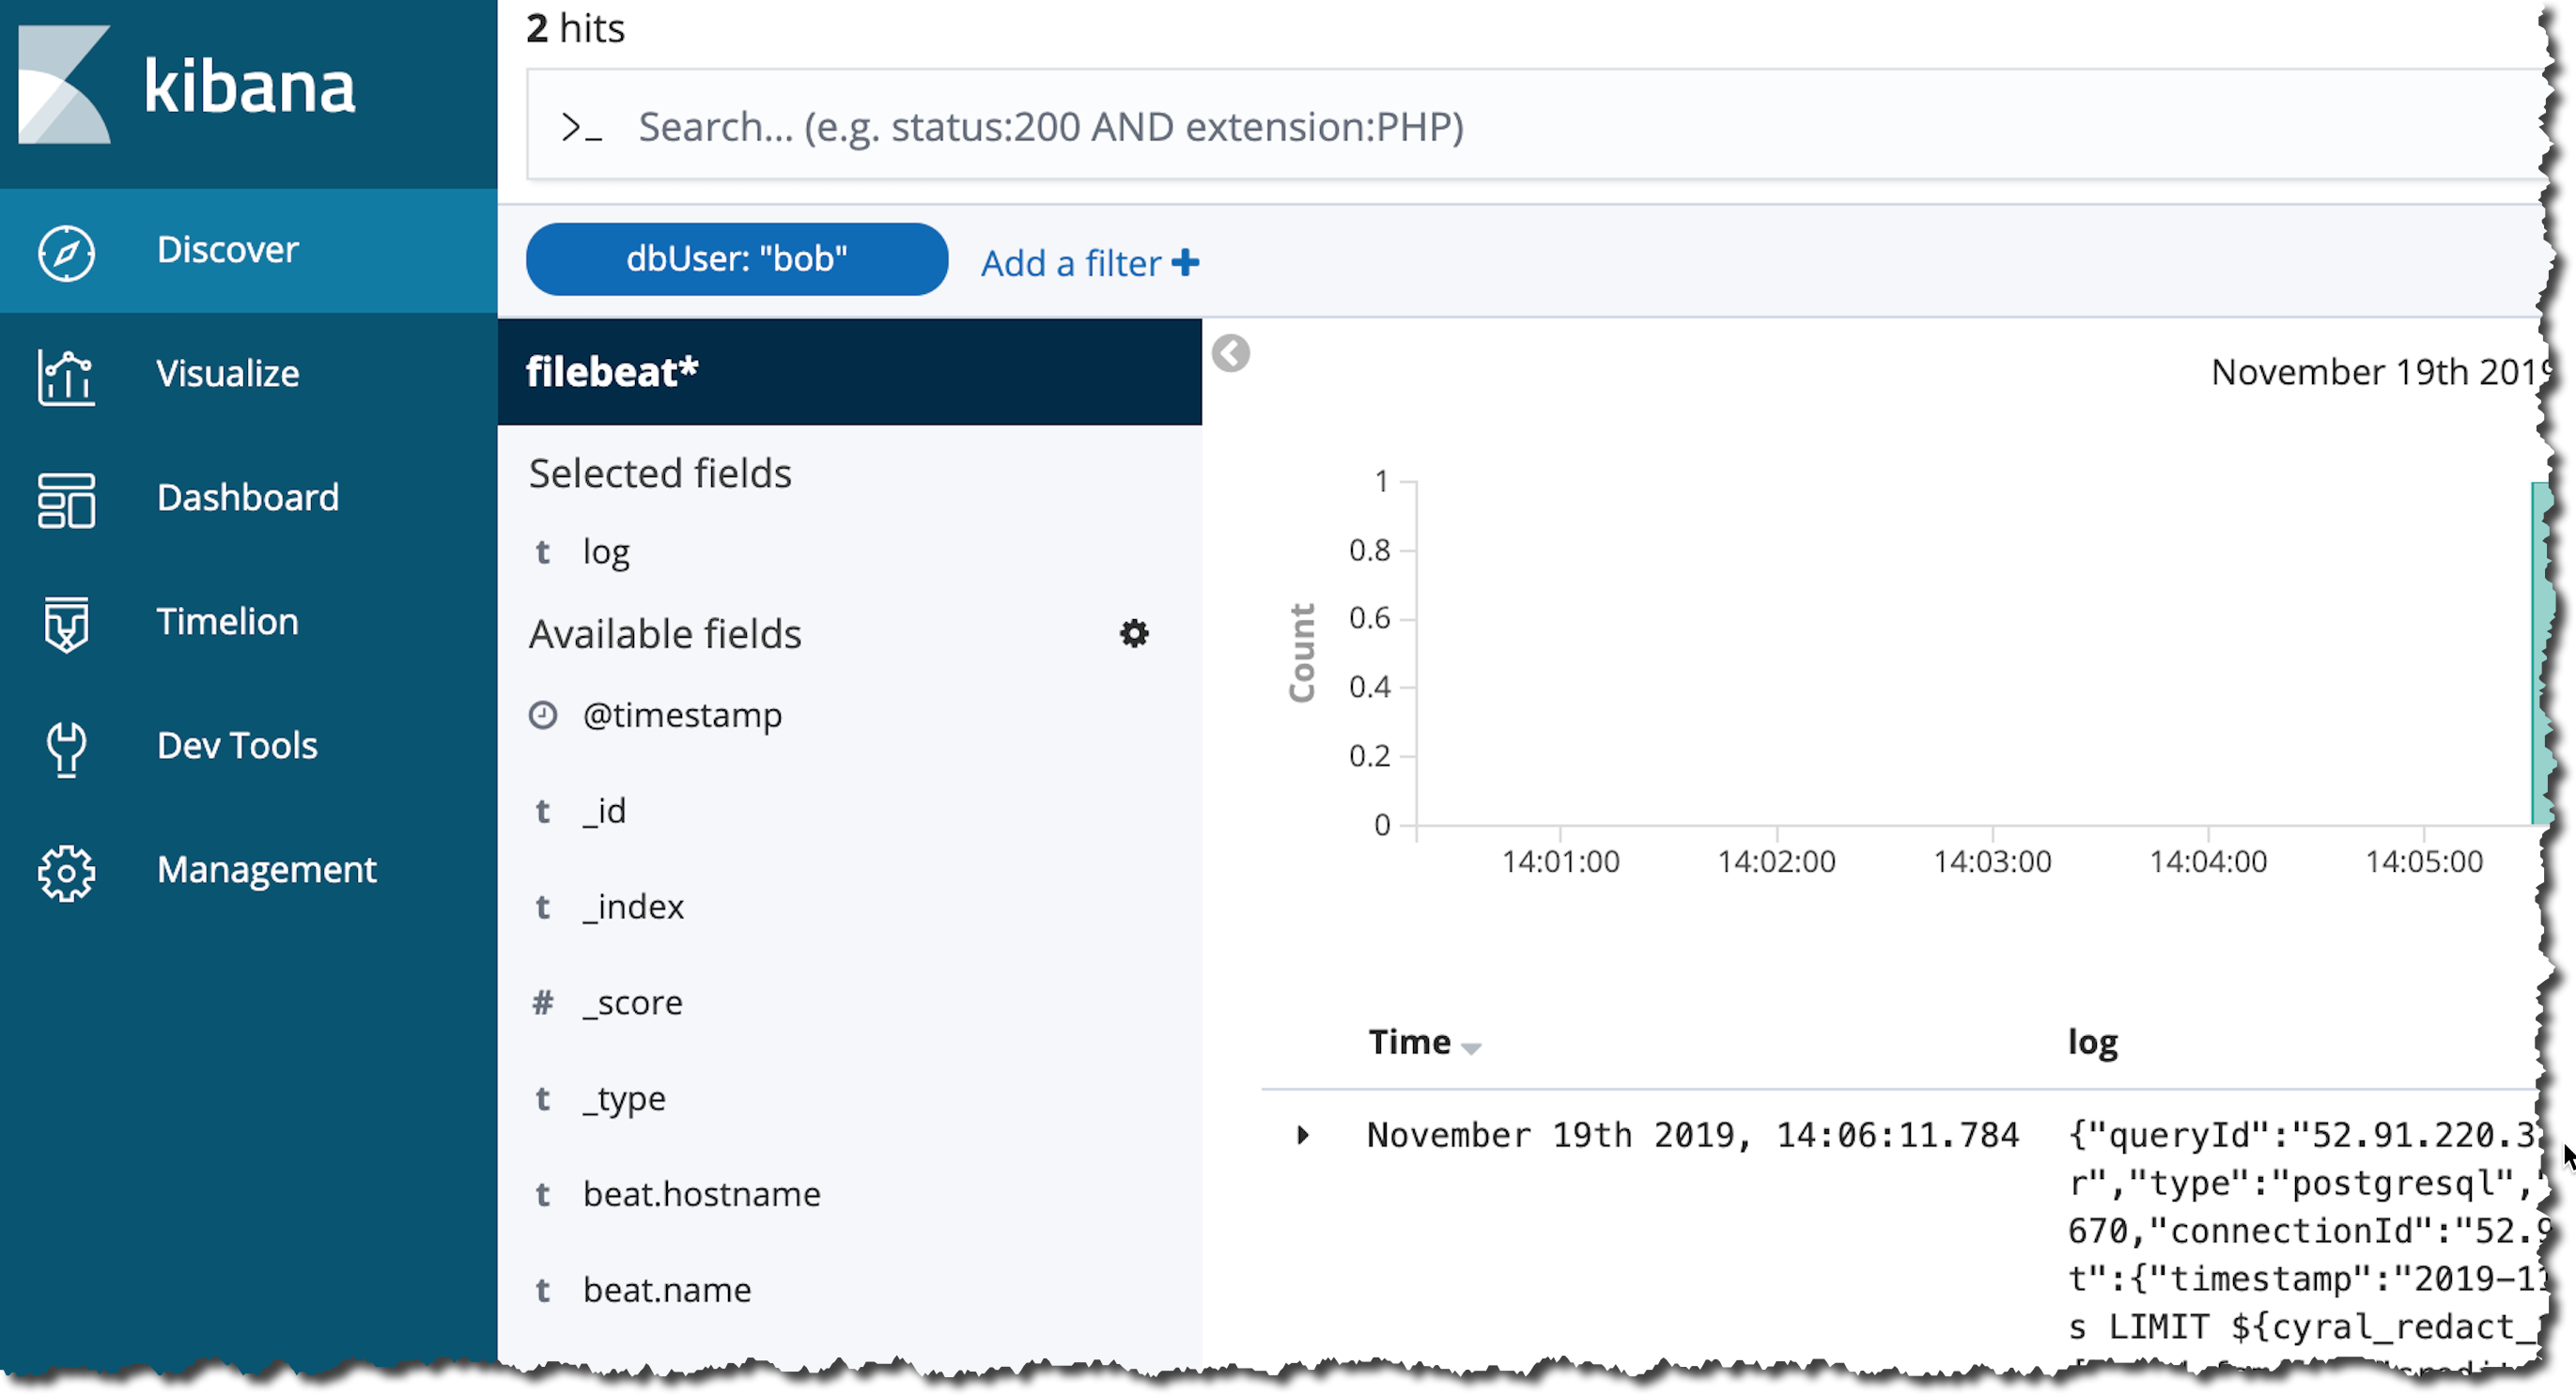
Once port forwarding is established, use your browser to visit localhost:5601.
To limit the view to show only query logs by, search for the log field endUser in the search bar.
Import the performance insights dashboard into Kibana
Cyral provides a dashboard you can import into your Kibana to observe
performance insights based on the query logs generated by your
sidecars. Importing this also creates an index matching the pattern
filebeat* to capture logs produced by sidecars.
Download the Performance Insights Dashboard file by clicking Integrations: ELK: Configure, clicking the Download Kibana Dashboards button and choosing the appropriate version.
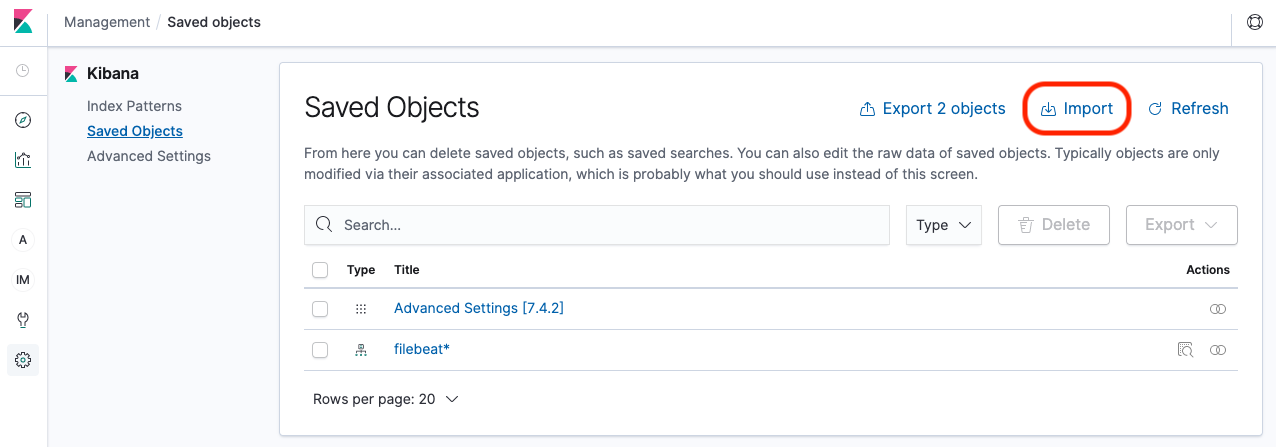
Navigate to the Saved Objects tab in the Management page (in the sidebar), and click Import. You can expand the sidebar using the button in the bottom left of the screen to make navigation easier.
Select the
cyral-dashboard-<VERSION>.ndjsonfile, where<VERSION>corresponds to the Kibana Dashboard version downloaded. Check the toggle to Automatically overwrite all saved objects, and click open.
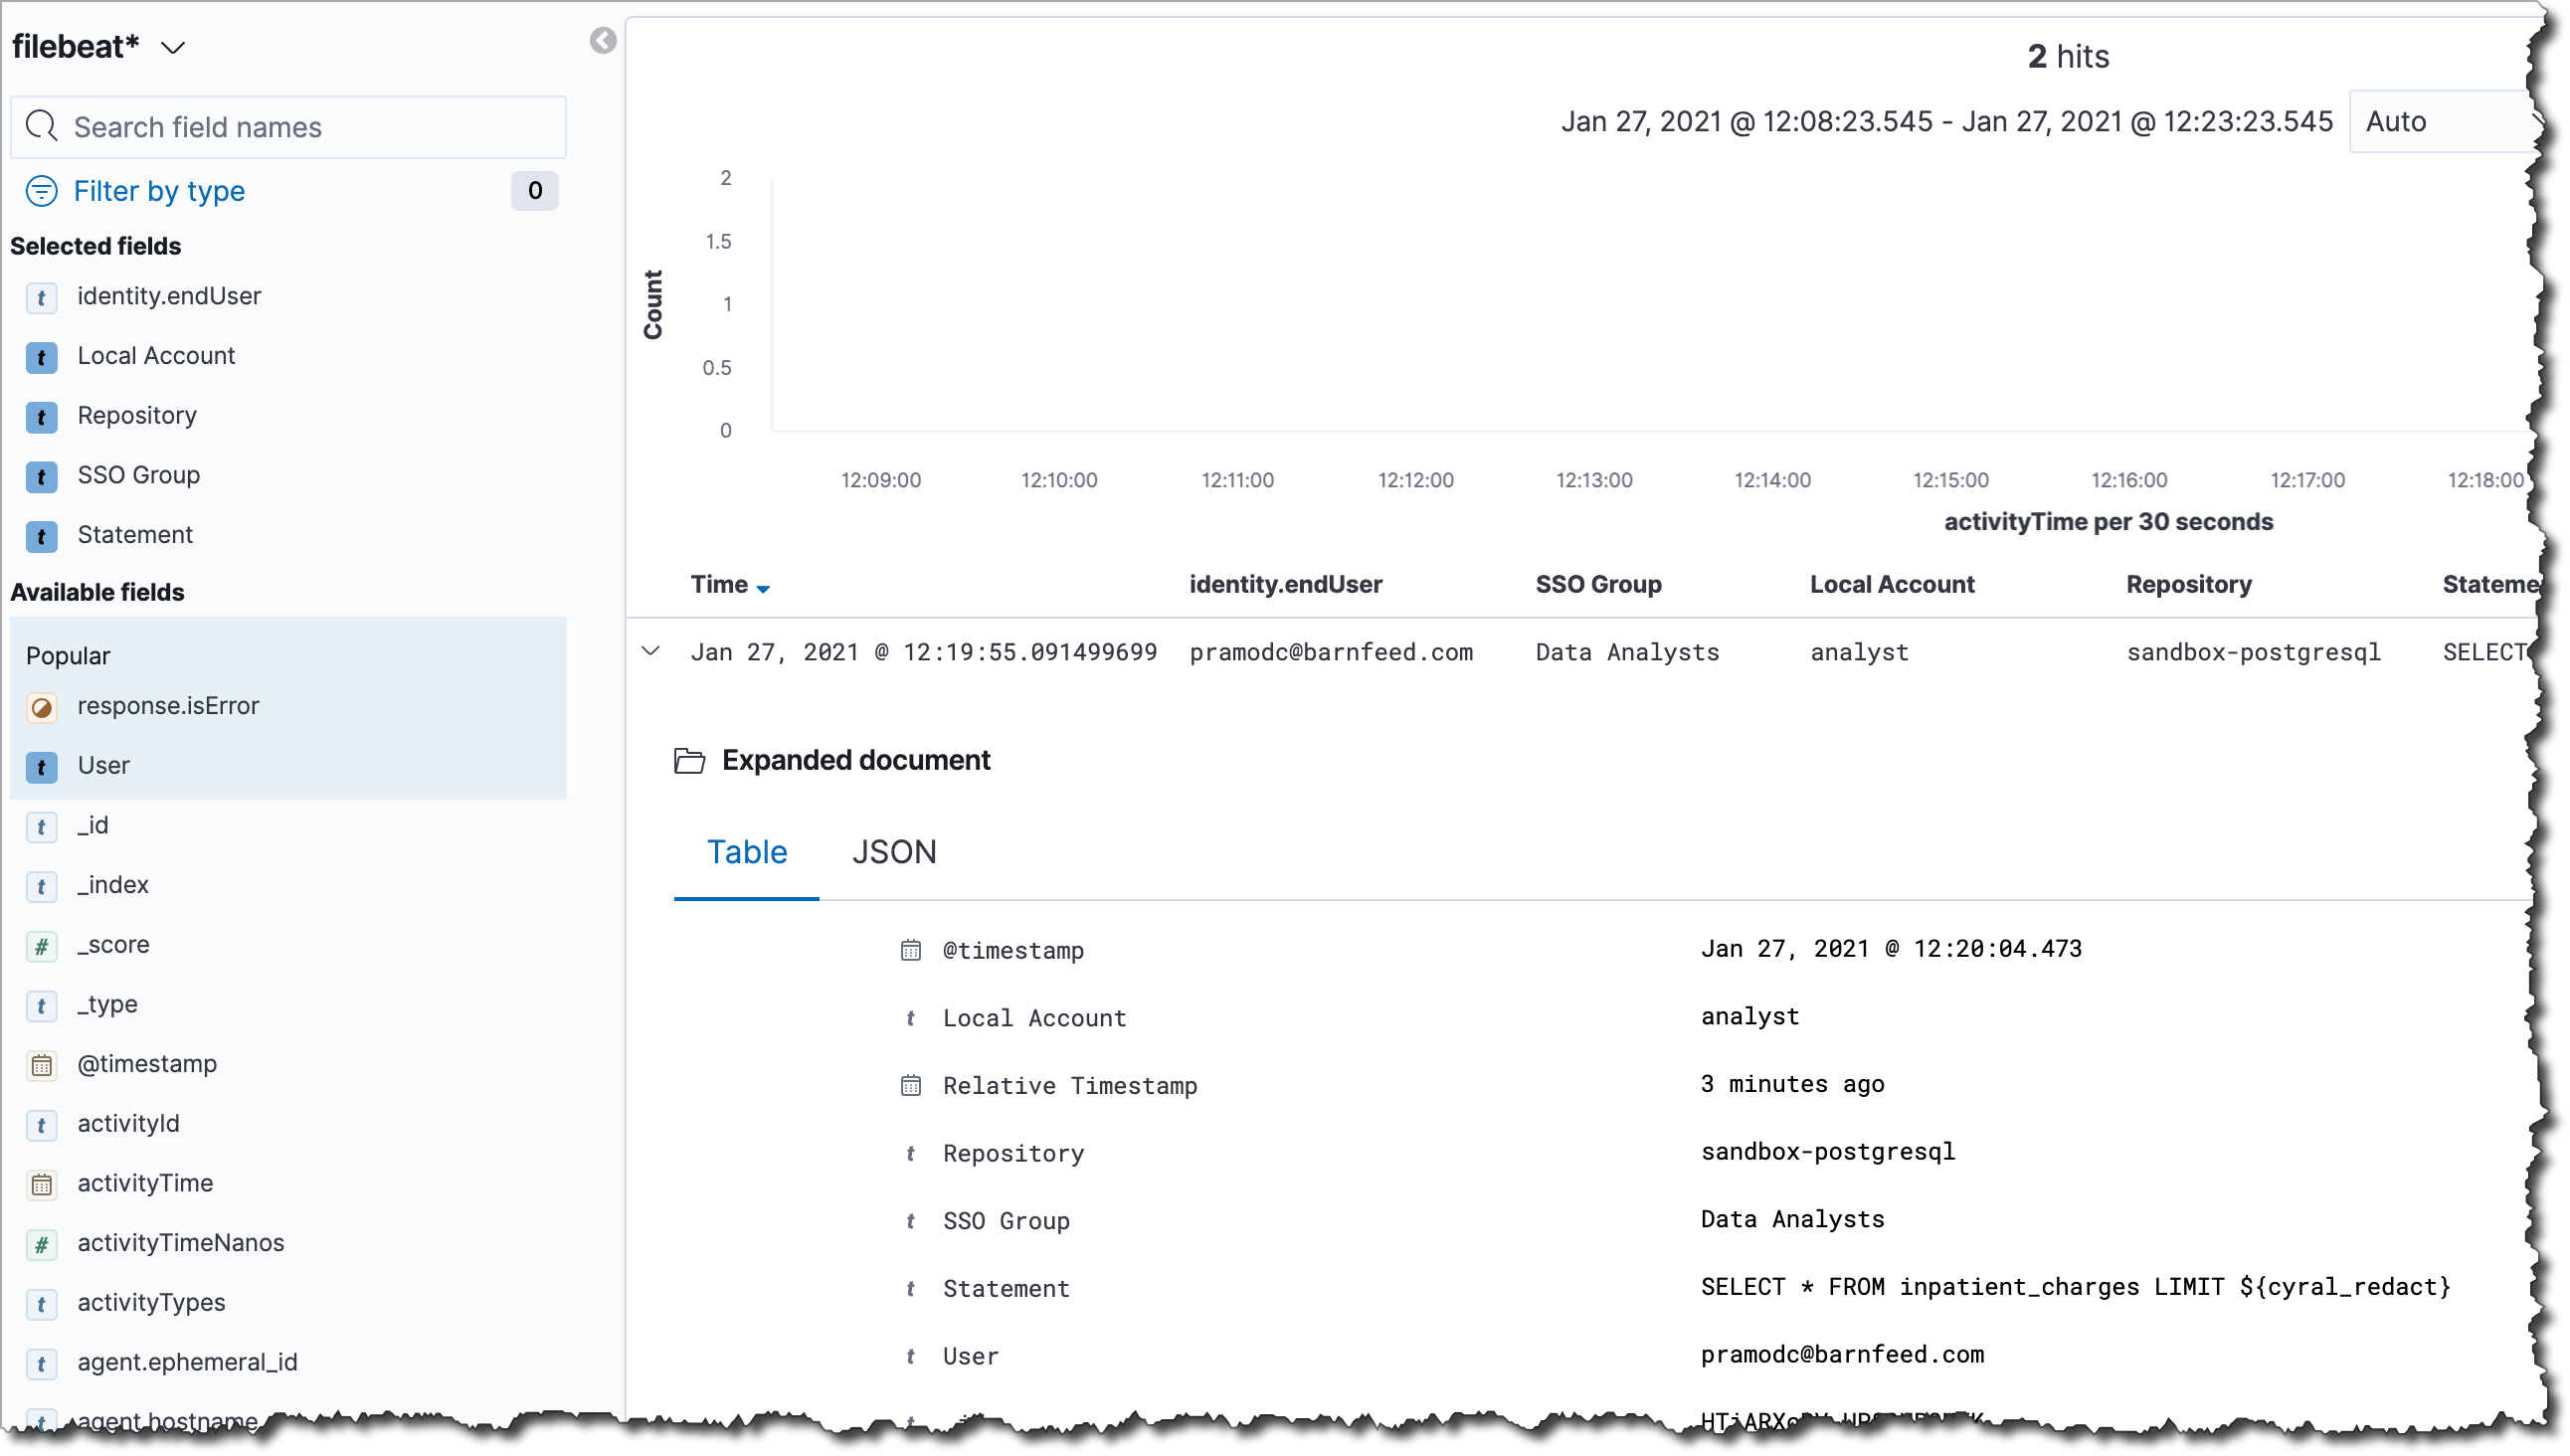
The Performance Insights dashboard should now be available, and you can find it by navigating to the Dashboards page (in the sidebar).
Next steps
- For more about monitoring a data repository, see Monitor all data activity from users and services.
- To understand log contents, see the Log Specification.
- Learn more about logging preferences.