Send Cyral logs to ELK stack
Follow the steps below to configure Cyral to output repository activity logs to ELK.
Prerequisites
Procedure
Navigate to the Integrations page in the sidebar.
Click Setup or Configure on the Logging card, and click the New Integration button.
Select ELK from the list of integration platforms.
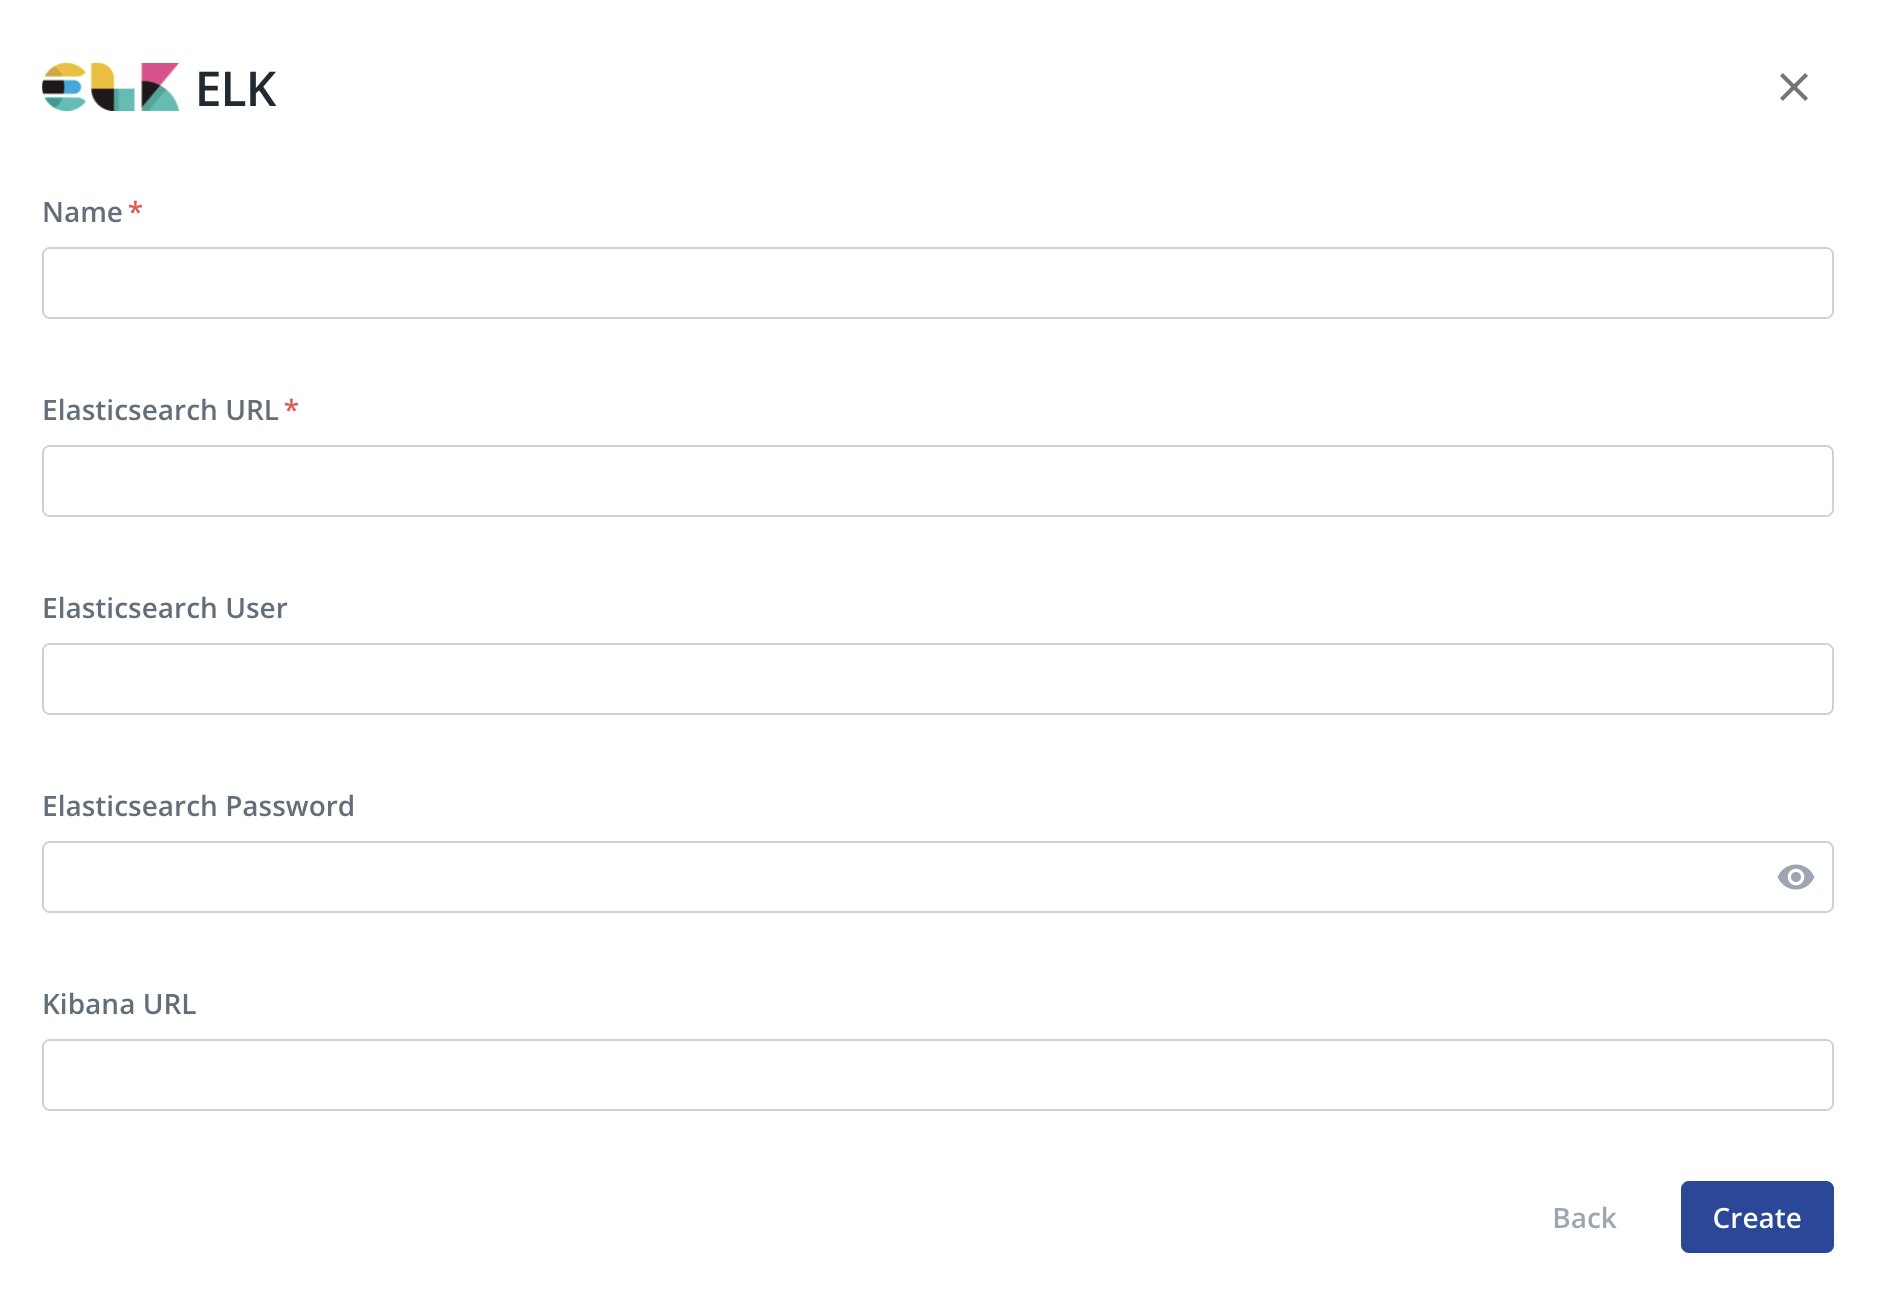
In the ELK configuration form, you will be prompted to enter the following:
- Name: A unique, recognizable name of your choice.
- Elasticsearch URL: Address where Elasticsearch is available.
- Elasticsearch User: (Optional) The username of the Elasticsearch user to use, if applicable.
- Elasticsearch Password: (Optional) The password of the Elasticsearch user, if applicable.
- Kibana URL: (Optional) The Kibana server's hostname.

Click Create.
For each sidecar that will send logs to this destination, configure the sidecar's advanced logging settings and select this integration for Data Activity Logs and/or Diagnostic Logs. For more information, see "Manage Sidecars -> Logging".
Monitor data activity in Kibana
Once the ELK integration is configured, administrators will be able to view and monitor data repository activity logs in Kibana.
Data activity logs will be indexed under the Elasticsearch index pattern cyral-data-activity-logs-<YYYY-MM-dd>.
Prerequisites
- Set up an ELK stack
- Turn on data activity monitoring for your repository
- Specify your logging preferences for each repository monitored by Cyral.
Generate sample log data
If you haven't already done so, run a few queries to generate query logs.
- If your repository is set to log all activity, any query will do.
- If you have a policy that logs only certain types of activity, run a query that falls within the scope of the policy.
Import the performance insights dashboard into Kibana
Cyral provides a dashboard you can import into your Kibana to observe
performance insights based on the query logs generated by your
sidecars. Importing this also creates an index matching the pattern
filebeat*,cyral* to capture logs produced by sidecars.
To import the dashboard, follow the steps on the Kibana Dashboards and Elastic Index Templates quickstart guide.
Next steps
- For more about monitoring a data repository, see Monitor all data activity from users and services.
- To understand log contents and configuration, see Sidecar Logging.
- Learn more about logging preferences.