Monitor data activity from users, tools, and apps
You can use Cyral to monitor activity on your data repositories. Sidecars output data activity logs which describe queries to your data, detailing who is accessing which data and how they are doing so.
Setting up a log destination
Cyral sends data activity logs to various data visualization tools which are listed in the Integrations section of the Cyral Management Console. In this guide, we show how to use ELK as a log destination. See Send Cyral logs to ELK stack if you'd like to do the same, or see the logging integrations instructions for other log destinations.
Setting up a repository for monitoring
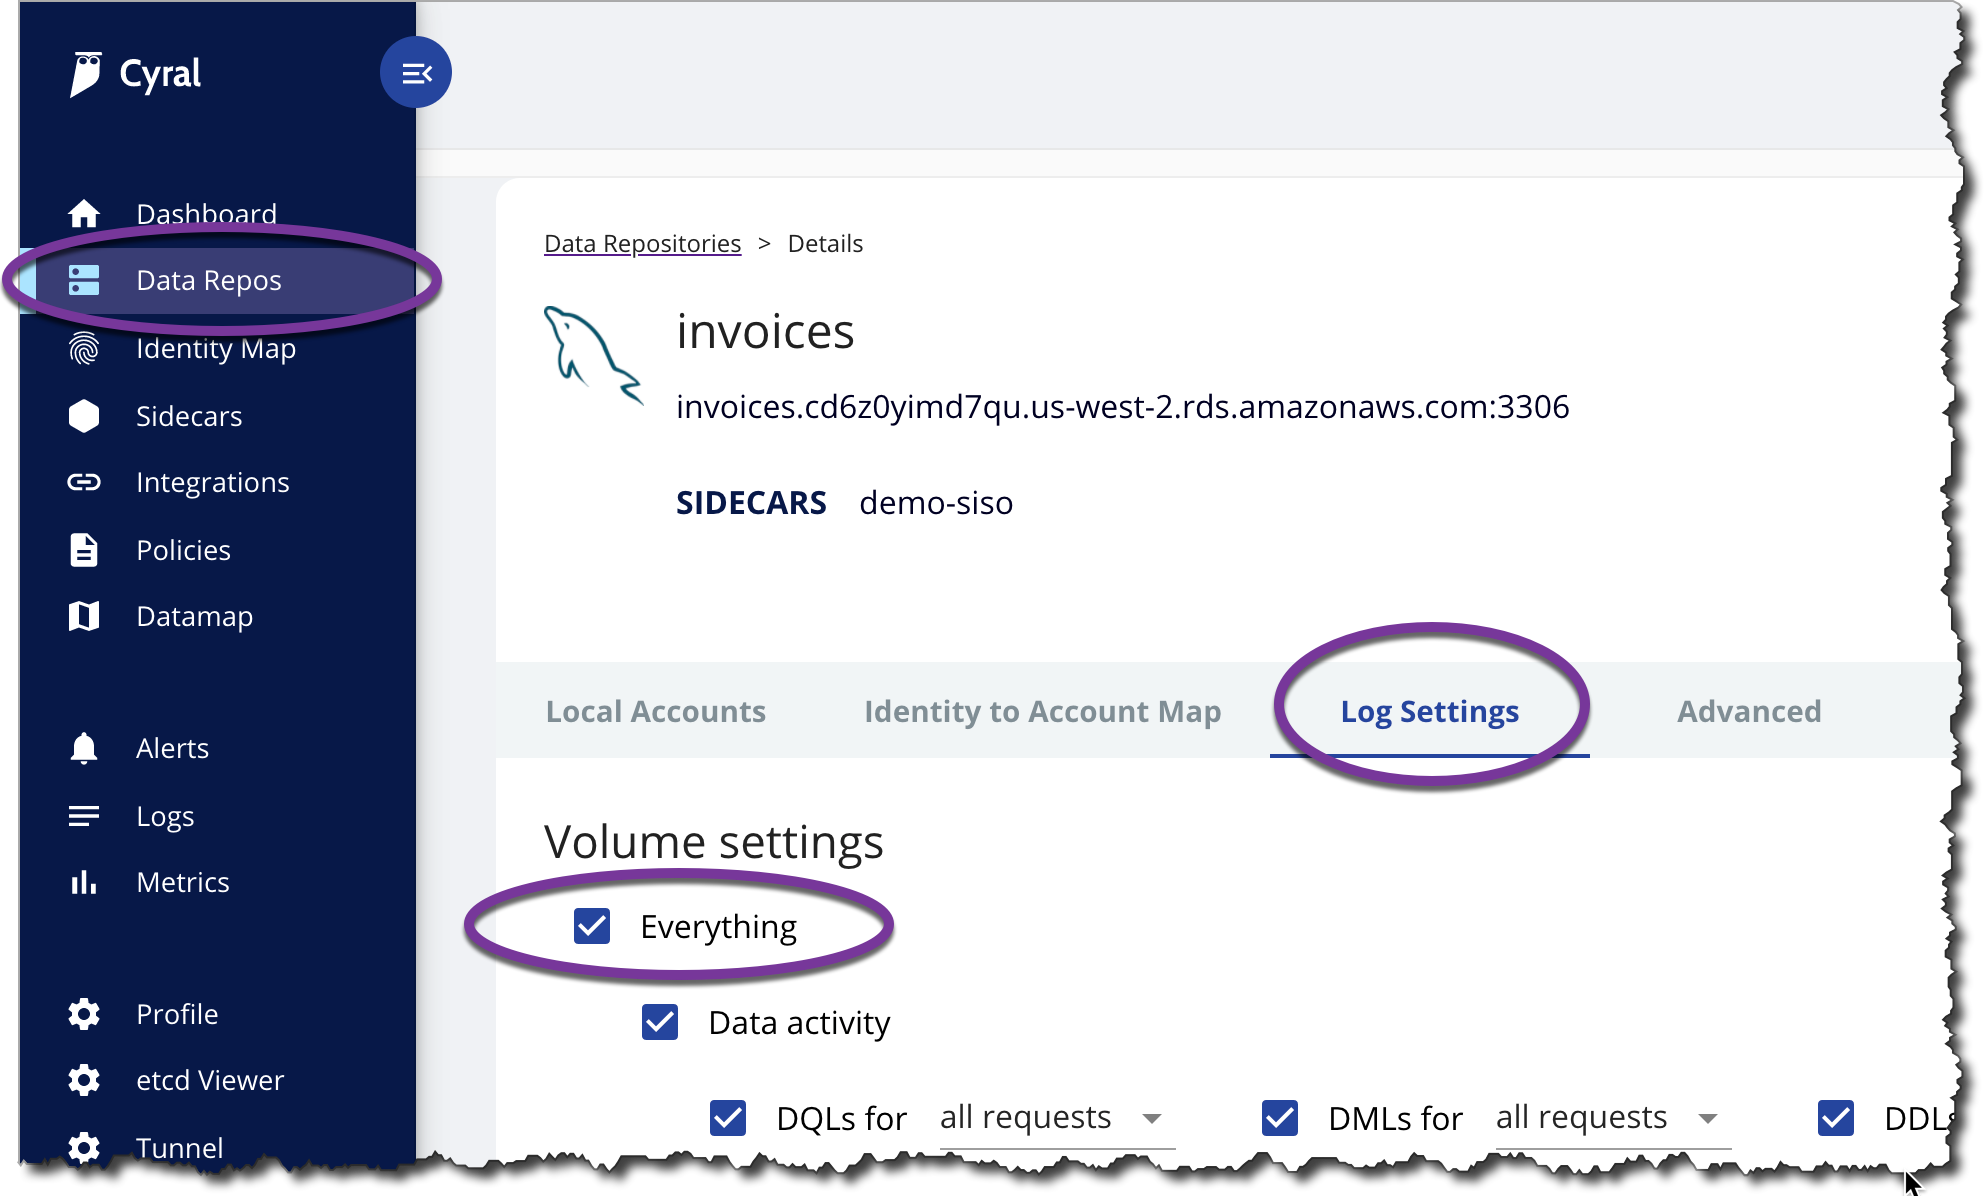
To monitor a data repository, first track the repository in Cyral and assign it to a sidecar. Once this is done, you can enable complete access logging by choosing Data Repos :arrowright: _your repo's name ➡️ Config ➡️ Data Activity Logs ➡️ tk resume here Log Settings: Everything in the repository configuration. Now, all accesses to this repository will be logged by the sidecar and sent to its configured log destination.
Viewing data activity logs
Since we've configured an ELK stack to be our log destination, we can view data activity logs in Kibana. All we need to do is generate some traffic.
After connecting to your data repository through your sidecar, query your data as you normally would. Then, you should see a corresponding data activity log in your configured log destination.
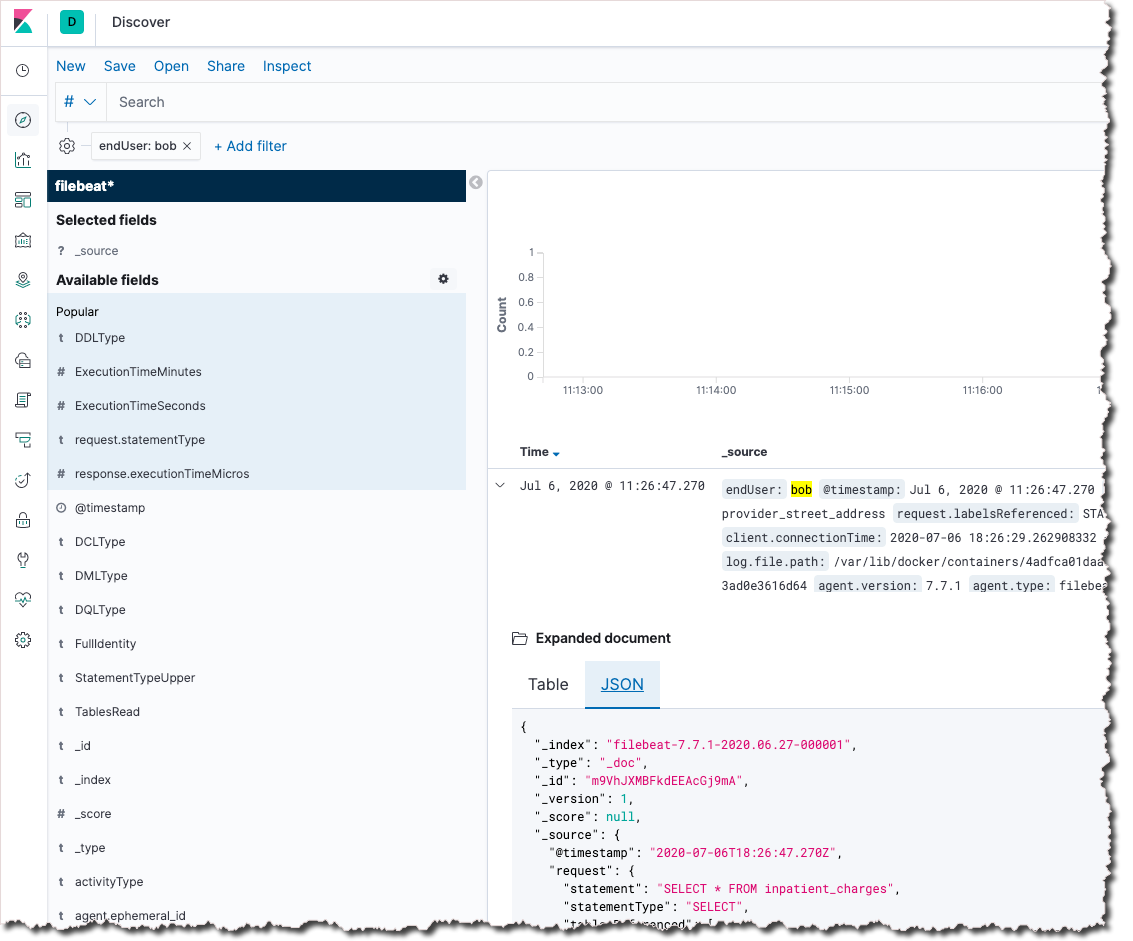
For example, executing the query
SELECT * FROM inpatient_charges;
results in the data activity log shown here in the Discover tab of Kibana. The log contains information such as what tables and attributes were accessed, how long the query took to execute, and who executed the query and from which machine. For a complete description of the data activity log contents, please see our log specification.
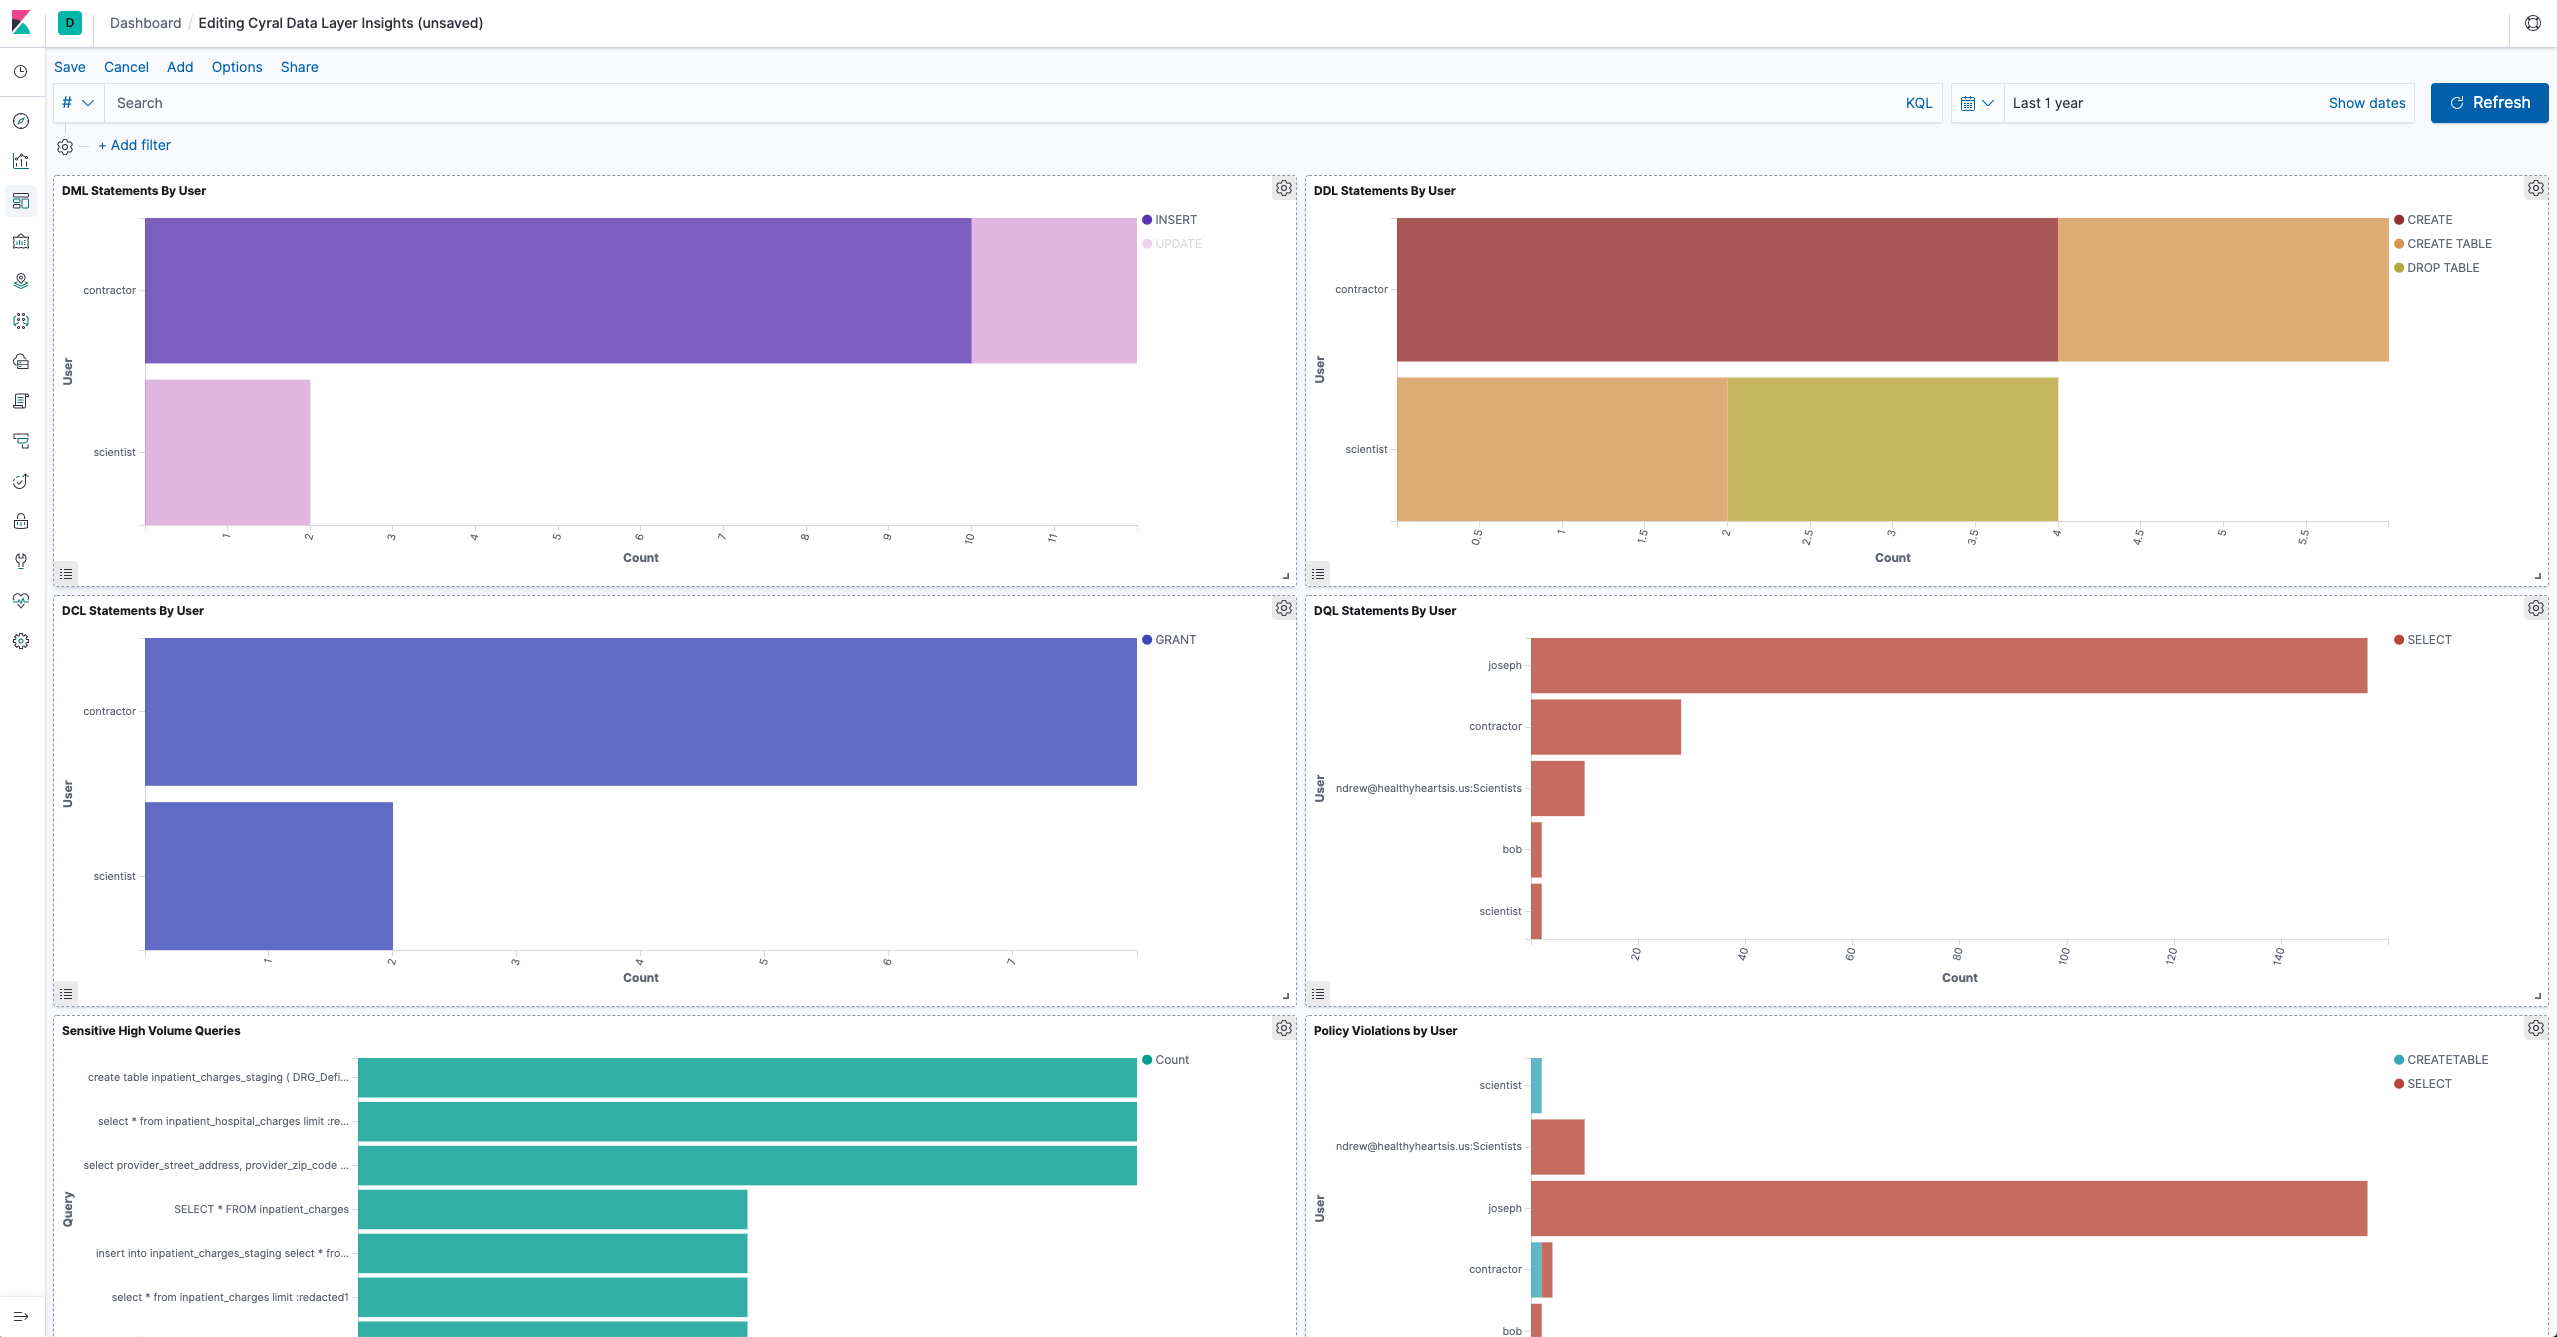
Visualizing data activity
Cyral provides a pre-built Kibana dashboard which aggregates the information in the data activity logs to provide insight into your data activity. See our Kibana instructions for the steps to import the dashboard into your Kibana app.
Once imported, you can view the dashboard to see the breakdown of what types of queries are run against your data repositories, which queries return high volumes of data, which data repositories see the most port scans and authentication failures, and more.