Customize how Cyral logs are sent to a logging destination of your choice
Cyral sidecars have an embedded Fluent Bit engine, which can be utilized to customize how both Cyral data activity logs and sidecar diagnostic logs are shipped to various log management destinations. The Custom logging integration is the way to customize how logs are shipped using the sidecar's embedded Fluent Bit engine.
Like other the supported logging platforms, a Custom integration must be created and mapped to a sidecar (or sidecars) for it to function.
Navigate to the Integrations page in the sidebar.
Click Setup or Configure on the Logging card, and click the New Integration button.
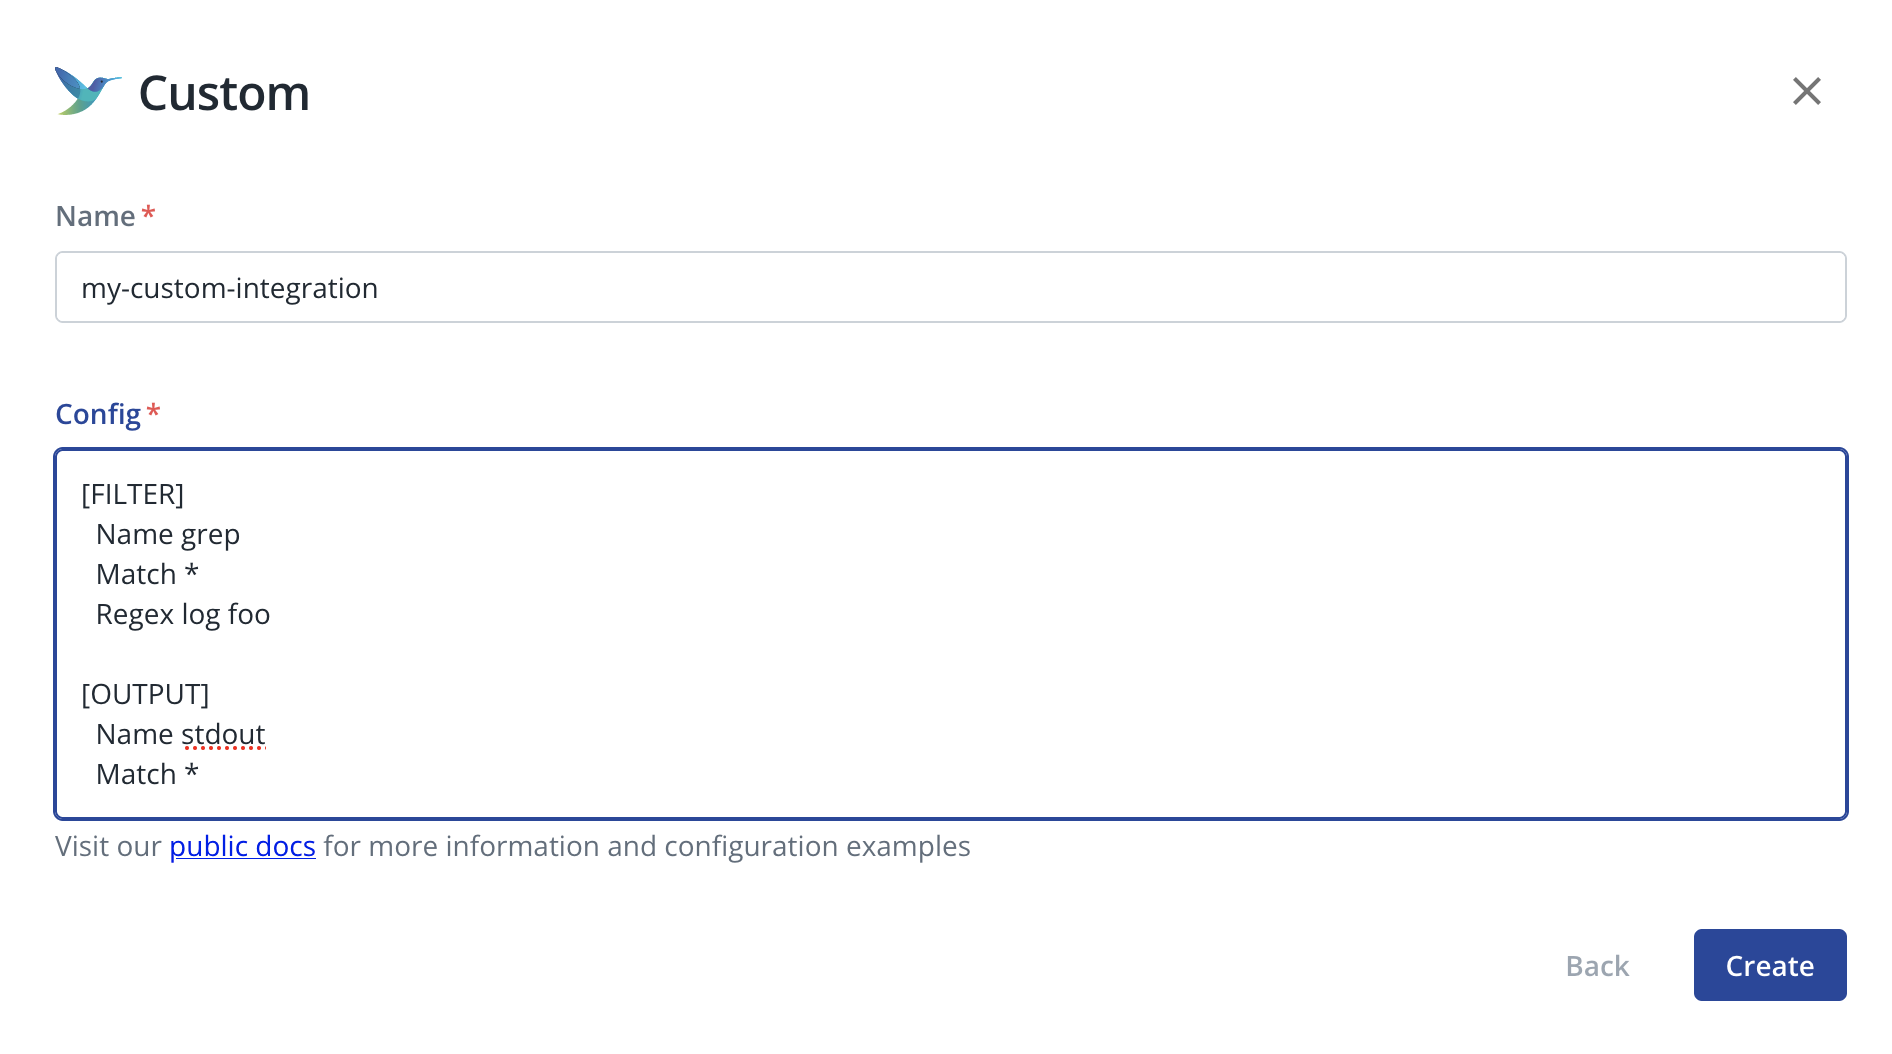
Select Custom from the list of integration platforms.
Give this integration an identifiable Name of your choice.
In the Config text region, provide a valid Fluent Bit configuration (more on this below).
Click Create.
- For each sidecar that will send logs to this destination, configure the sidecar's advanced logging settings and select this integration for Data Activity Logs and/or Diagnostic Logs. For more information, see "Manage Sidecars -> Logging".
Creating a custom Fluent Bit configuration
The Config text must be a valid "classic mode" Fluent Bit configuration.
However, Cyral only supports FILTER
and OUTPUT
sections in the config. Any other sections will be considered invalid and lead to an error. All the standard Fluent Bit
filter plugins and output plugins
are supported. Filters and outputs can be combined in any way supported by Fluent Bit, including combining multiple
filters and outputs.
Matching and Routing
Fluent Bit requires that plugins are configured to match log records for them to apply.
Cyral log records are tagged based on their output stream
and the sidecar service that generated them, in the format <stdout|stderr>-<service name>. For example
stdout-dispatcher and stderr-pg-wire. Cyral data activity logs are sent to the stdout stream, while diagnostic
logs are sent to the stderr stream.
Records can be matched and routed by their tag, using
wildcards. For example, to match
all Cyral data activity logs from all services, one could write a match rule Match stdout*. Alternatively, to match
only diagnostic logs, one could write the match rule Match stderr*. To match all sidecar logs, one could use
Match * or Match std*, for example.
Examples
Below are a few examples of possible Fluent Bit configurations that can be used to customize how sidecar logs are shipped to various log management platforms. Please note that these are examples only and are not functional by themselves without customization for your environment. Also note that the examples are not exhaustive - there are many more filter and output plugins which can be used. Please see the Fluent Bit documentation for more details.
Amazon S3
The following example config will send only sidecar diagnostic logs (note the stderr* match) to Amazon S3 (to the
bucket example-bucket in the us-east-2 region), using the Amazon S3 output plugin:
[OUTPUT]
    Name             s3
    Match            stderr*
    Region           us-east-2
    Bucket           example-bucket
    Total_file_size  1M
Note that for S3, the sidecar will need permissions to put objects to S3 (s3:PutObject),
and AWS credentials must be available to the sidecar via environment variables or other standard methods (IAM instance
profile, etc.). See the Fluent Bit Amazon S3 output plugin documentation for more details.
ELK
The following example config will send all Cyral data activity logs (note the stdout* match) to an ElasticSearch,
using the Elasticsearch output plugin. Data activity logs will
be indexed under the Elasticsearch index pattern cyral-data-activity-logs-<YYYY-MM-dd> as defined by the Logstash_Prefix configuration:
[OUTPUT]
    Name     es
    Match    stdout*
    Host  192.168.2.3
    Port  9200
    Logstash_Format On
    Logstash_Prefix cyral-data-activity-logs
warning
The ELK integration configuration may be different depending on where it is hosted. See your ELK-hosting provider instructions and refer to the Elasticsearch output plugin documentation for additional information.
Kafka
The following example config will send all sidecar logs (both data activity logs and diagnostic logs - note the *
match) to Kafka, using the Kafka output plugin:
[OUTPUT]
    Name     kafka
    Match    *
    Brokers  192.168.1.3:9092
    Topics   test
Slack
The following example config will send all Cyral data activity logs (note the stdout* match) to a Slack channel,
using the Slack output plugin:
[OUTPUT]
    Name     slack
    Match    stdout*
    Webhook  https://hooks.slack.com/services/T00000000/B00000000/XXXXXXXXXXXXXXXXXXXXXXXX
Monitor data activity in Kibana
Once the ELK integration is configured, administrators will be able to view and monitor data repository activity logs in Kibana.
Prerequisites
- Set up an ELK stack
- Turn on data activity monitoring for your repository
- Specify your logging preferences for each repository monitored by Cyral.
Generate sample log data
If you haven't already done so, run a few queries to generate query logs.
- If your repository is set to log all activity, any query will do.
- If you have a policy that logs only certain types of activity, run a query that falls within the scope of the policy.
Import the performance insights dashboard into Kibana
Cyral provides a dashboard you can import into your Kibana to observe
performance insights based on the query logs generated by your
sidecars. Importing this also creates an index matching the pattern
cyral* to capture logs produced by sidecars.
To import the dashboard, follow the steps on the Kibana Dashboards and Elastic Index Templates quickstart guide.
Grep Filter and Standard Output
The following example uses the grep filter plugin to filter only data activity logs generated by the end user
bob_hardy, and send them via HTTP POST to the URL http://example.com/logs, using the HTTP output plugin:
[FILTER]
    Name   grep
    Match  stdout*
    Regex  $identity['endUser'] bob_hardy

[OUTPUT]
    Name   http
    Match  stdout*
    Host   example.com
    Port   80
    URI    /logs
Next steps
- For more about monitoring a data repository, see Monitor all data activity from users and services.
- To understand log contents and configuration, see Sidecar Logging.
- Learn more about logging preferences.